ISTANBUL · INDEPENDENT GROUND OBSERVATIONS
CONNECTINGAtmosphere
Small changes. Measured over time.
ARAS AUTOMATIC ATMOSPHERIC MONITORING
STATUS: LOADINGPressure Warning
Waiting for measured pressure analysis…
Unverified anomalies only; no event-source attribution.
LIVE PRESSURE SPECTROGRAM
Atmospheric waterfall
Glacier · grayscale powerPeriod vs UTC · brighter = higher power
Hann windows · linear trend removed per window · no gap interpolation. Display limits are locked per period setting for this page session. Use the numerical dB scale; brightness alone is not an absolute comparison between sessions.
Pressure history
hPa · UTCPressure spectrum
Hz · dB re 1 Pa²/HzWaiting for the station.1 Hz acquisition · Pico H + BMP390
MEASURED ARAS PRESSURE DATA
Atmospheric Events & Reports
Published research summaries and automatic pressure alert entries. An alert is a statistical candidate, not a verified meteorological or geophysical event.
Observation Reports
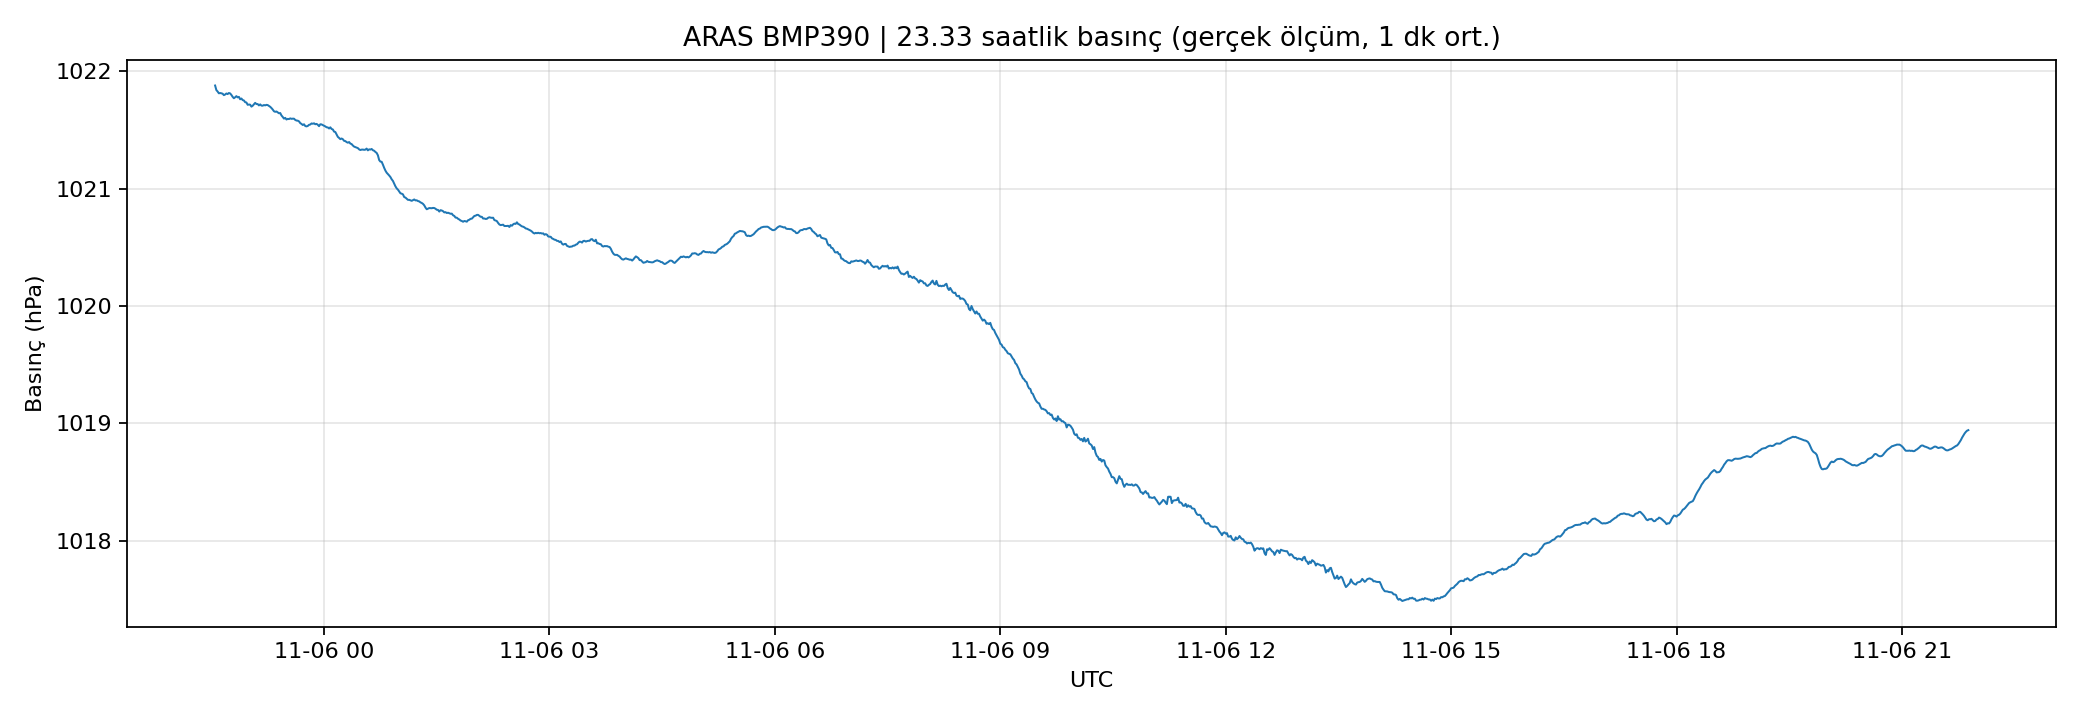
BMP390 — First 23 Hours
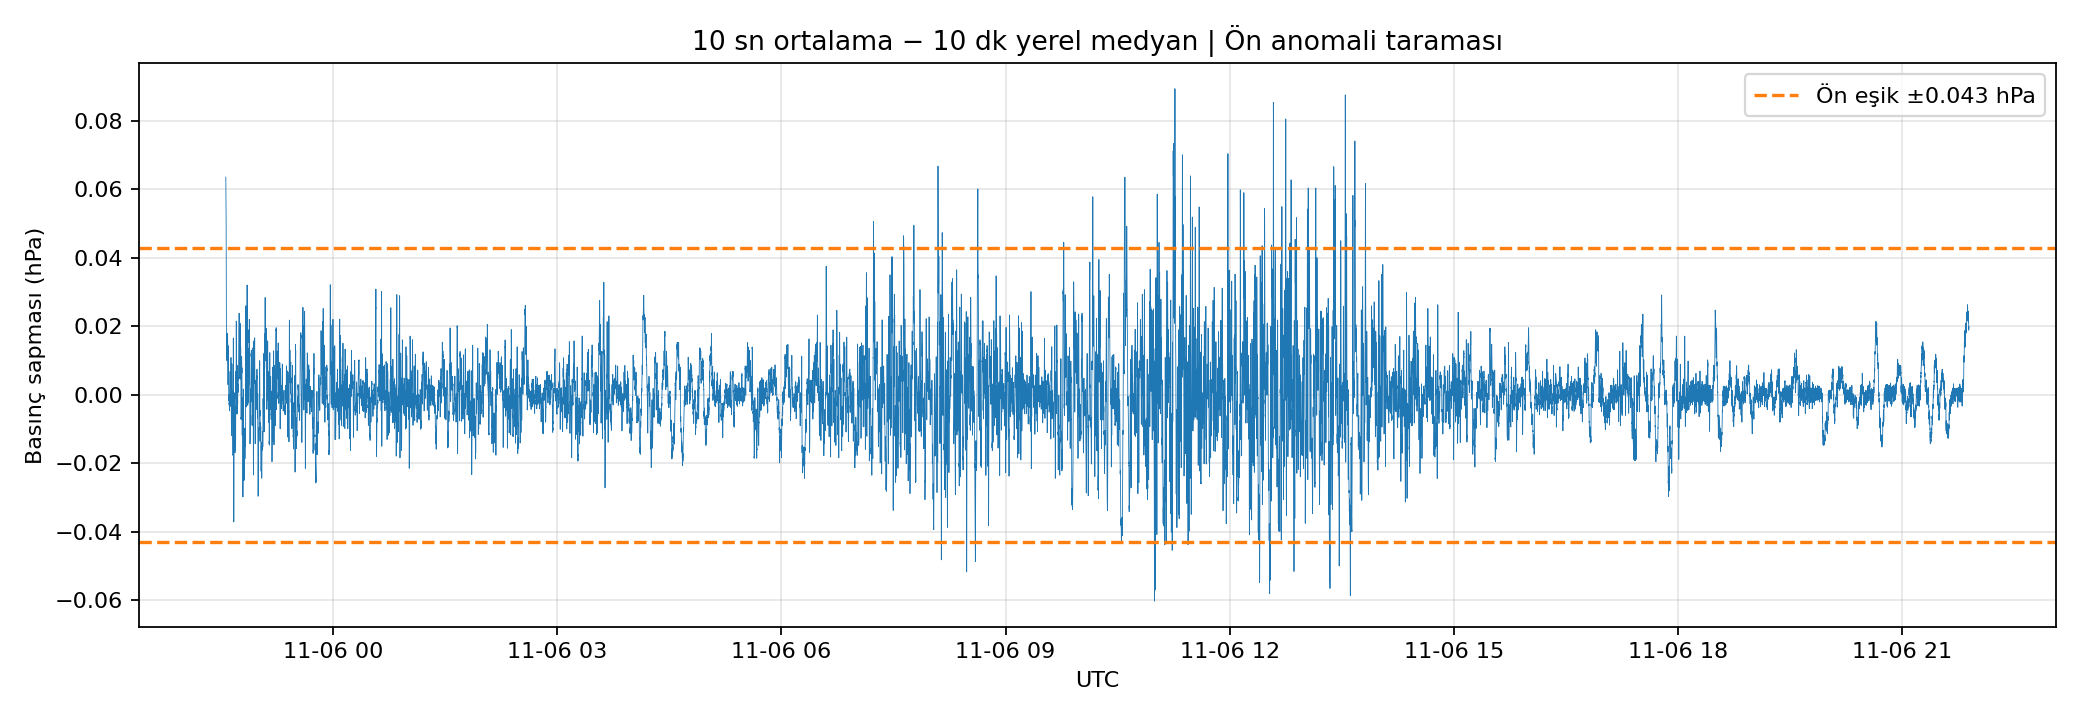
839,869 genuine pressure samples · 23.33 h · pressure change −2.9508 hPa · 37 preliminary fluctuations (unverified).
BMP390 — Follow-up Observation
744,302 measured samples · pressure change +5.9928 hPa · 37 retrospective screening candidates (unverified). No external source attribution.
Automatic Pressure Alerts
Loading measured alert history…
ACTUAL ARAS BMP390 MEASUREMENTS · 5–6 NOV 2026
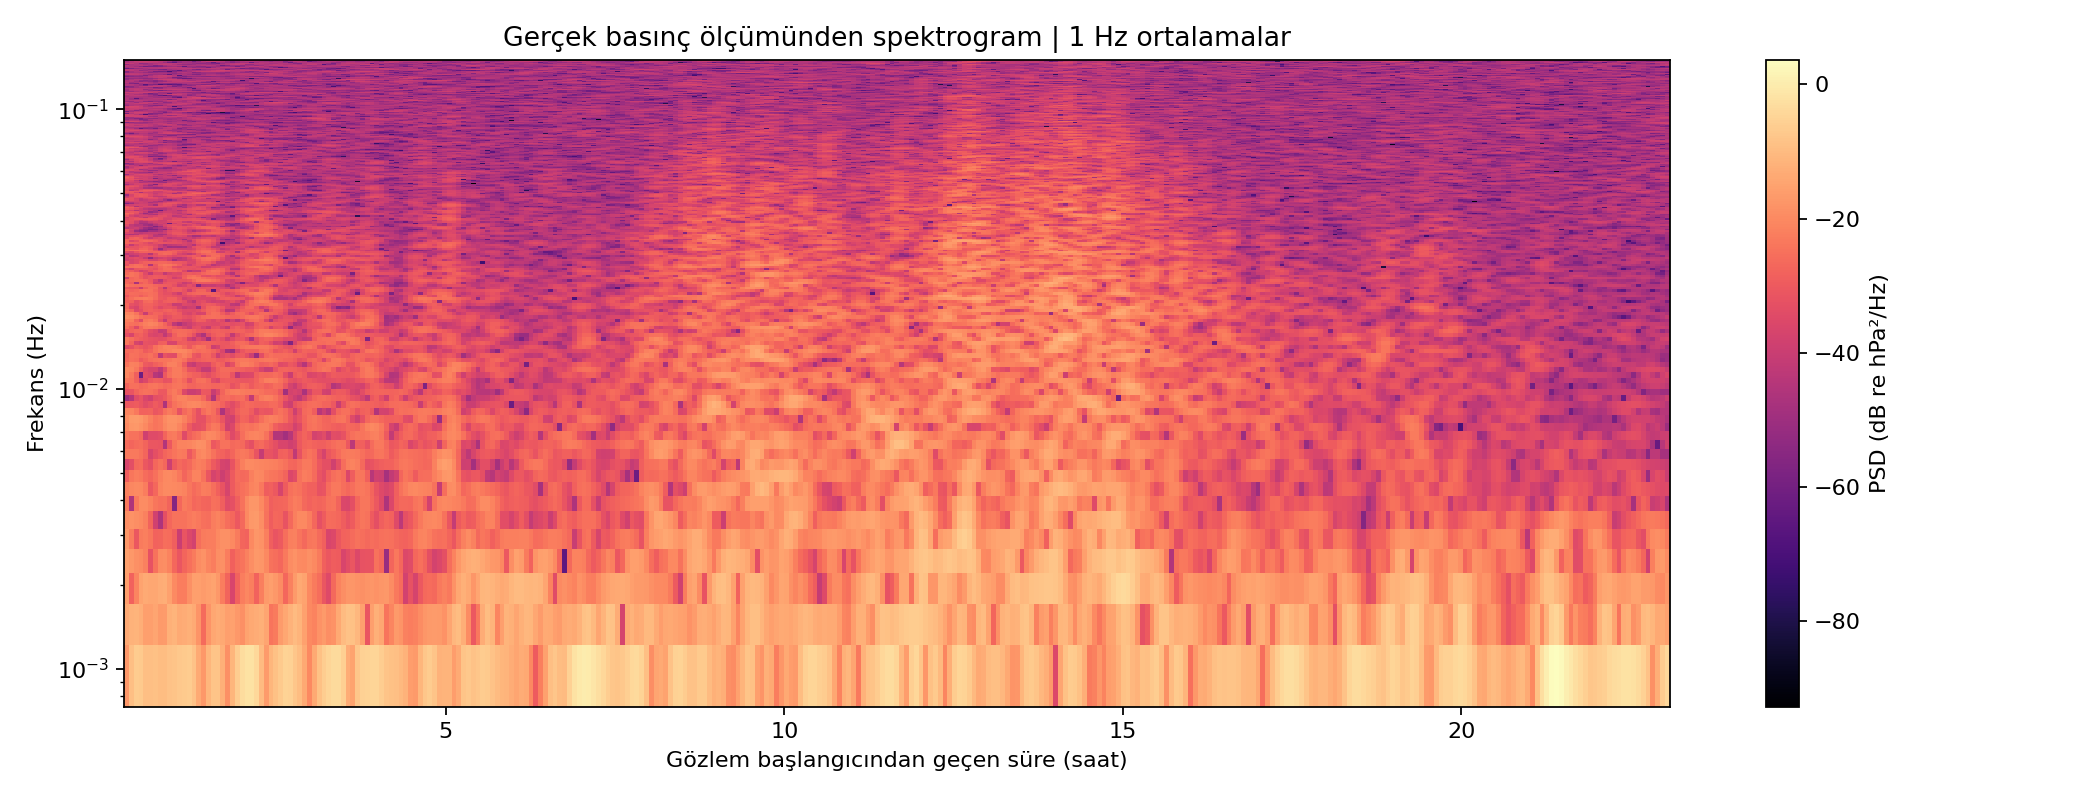
First 23 Hours · Scientific Visual Report
839,869 real measurements · 23 h 19 min · net change −2.9508 hPa · 37 unverified retrospective candidates. No confirmed external event.
MEASURED DATA / COMPLETED SESSIONS
—Observation archive
Completed sessions selected for publication. Each record includes measured plots, UTC metadata and the original CSV.
BMP390 · 20 h 40 min Follow-up Observation
744,302 genuine 10 Hz samples · 00:53:38–21:34:08 TSİ · +5.9928 hPa station-pressure trend · 37 unverified retrospective pressure-fluctuation candidates. No confirmed external event.
Read scientific report, PDF & measured 2D/3D figures ↗ · Compressed 10 Hz source CSV ↓
Loading observations…