ARAS Observatory / Independent atmospheric measurements / 2026-11-07
BMP390 — 20 h 40 min
Follow-up Observation
Measured station-pressure variation and retrospective short-period fluctuations following the initial 23-hour BMP390 session. Istanbul, Türkiye.
SCIENTIFIC STATUS — UNVERIFIED PRESSURE VARIATIONS. These are independent ARAS sensor measurements. No volcanic eruption, earthquake, explosion, meteor, or externally sourced infrasound event has been confirmed.
Observation window and raw signal
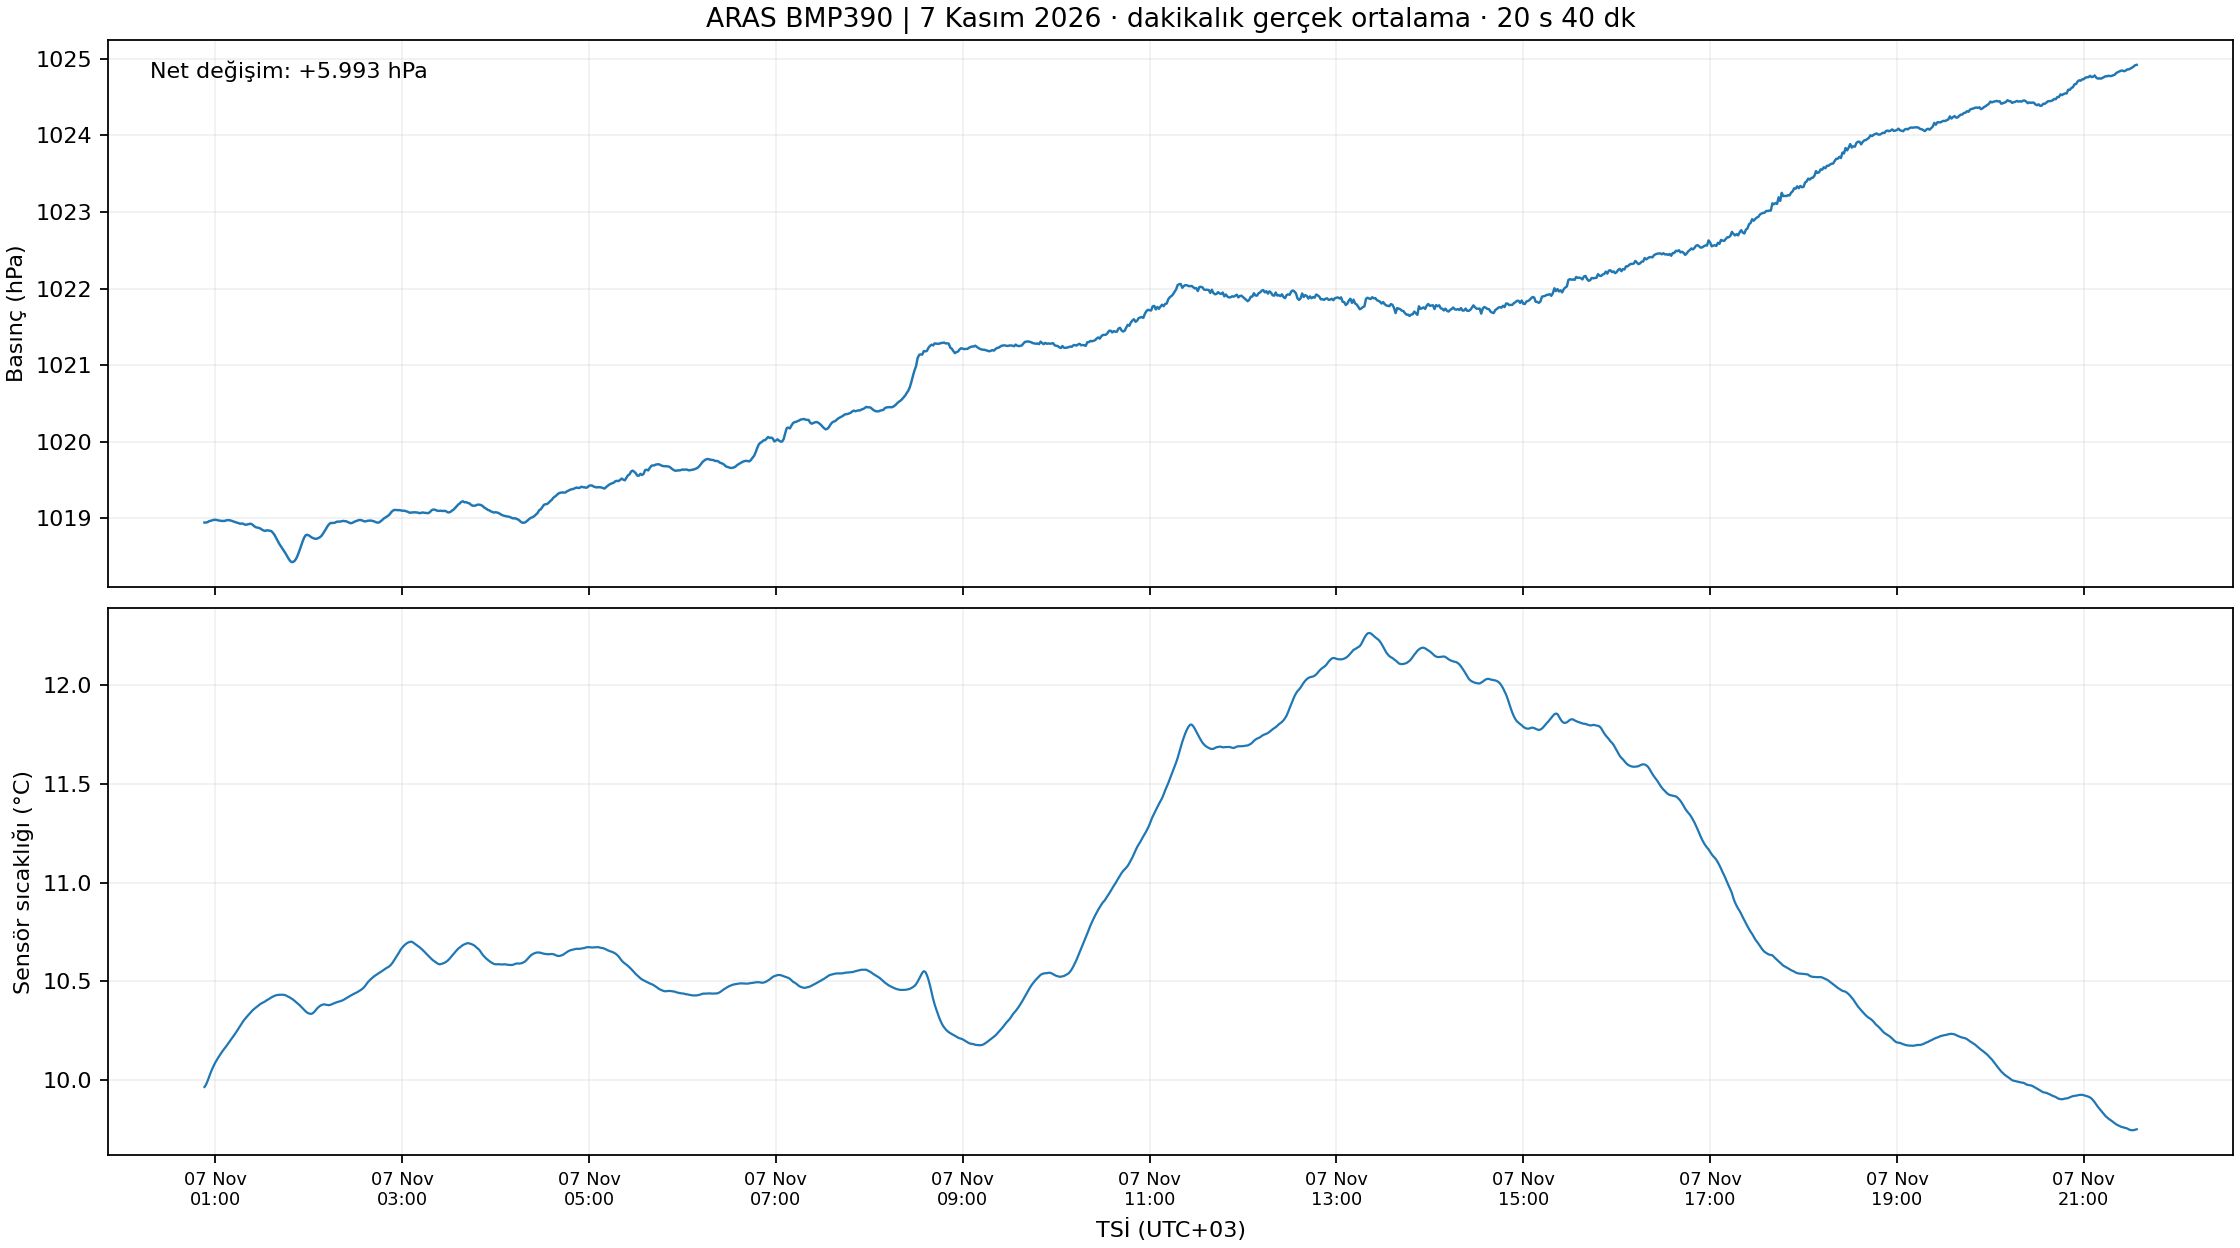
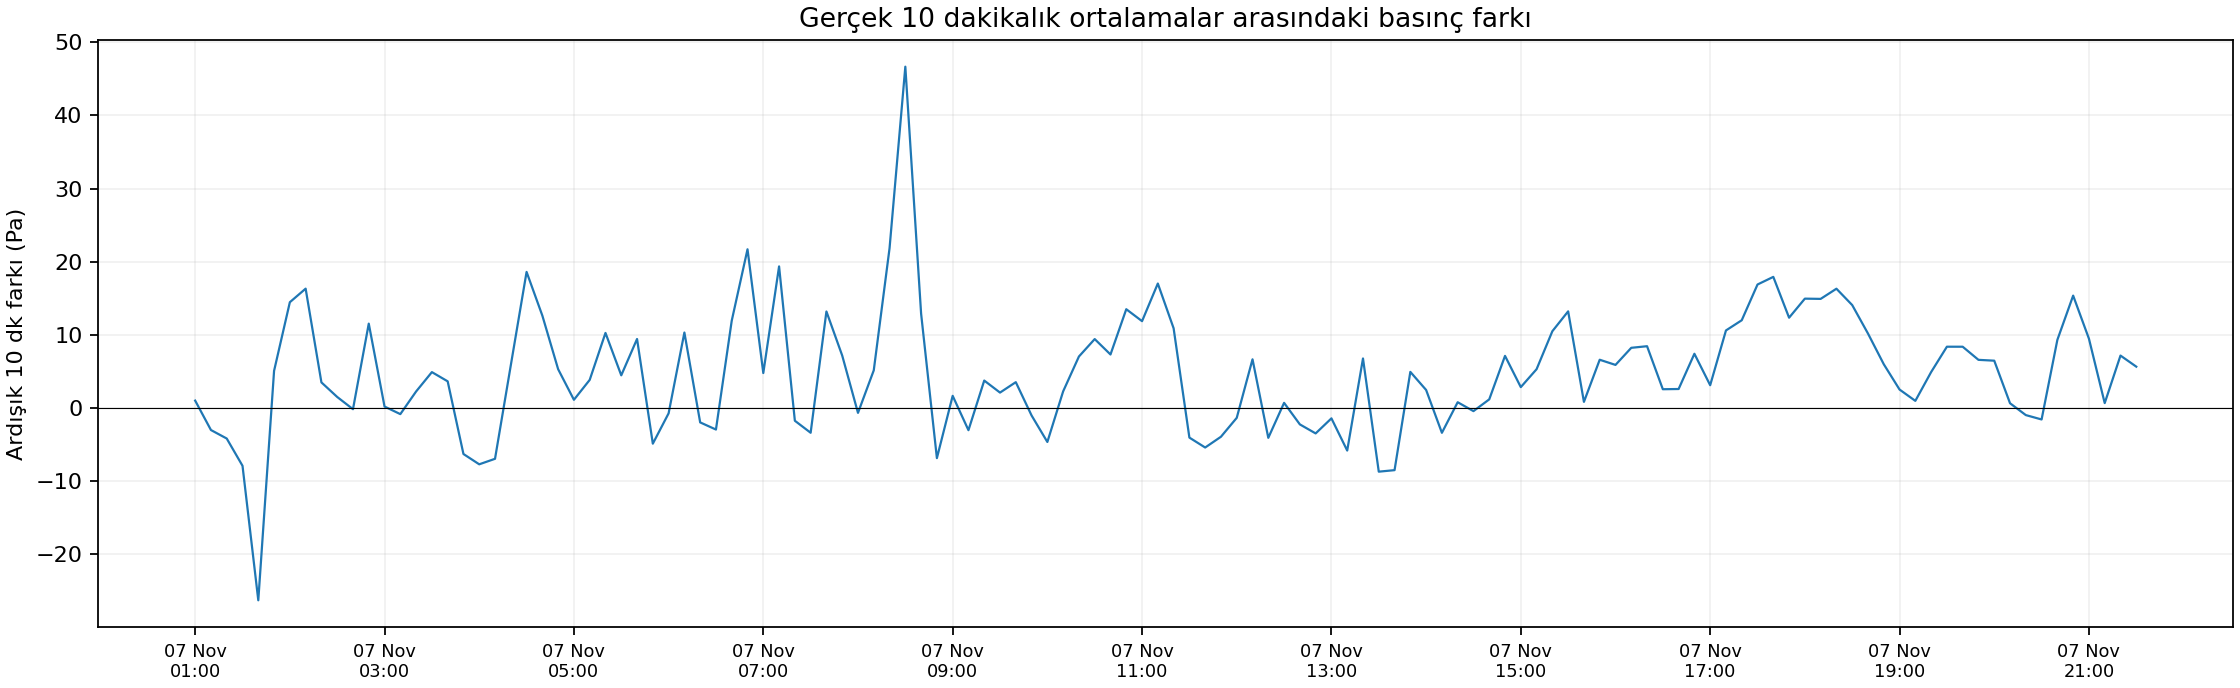
UTC: 2026-11-06 21:53:38.187 → 2026-11-07 18:34:08.156. TSİ: 2026-11-07 00:53:38 → 21:34:08. Nominal sample rate: 10 Hz. Pressure: 1018.9342 → 1024.9270 hPa; minimum 1018.3990 hPa, maximum 1024.9548 hPa. Sensor temperature ranged from 9.74 to 12.28 °C. The sensor-temperature series is not a calibrated outdoor air-temperature measurement.
Sample sequence is continuous with no missing integer-second bins, while host time stamps show up to 1.036 s between adjacent samples. Instrument-local timing is more regular (maximum consecutive interval 0.1044 s). Host transport jitter does not on its own establish a dropped sensor sample.
Interpretation: The +5.99 hPa net rise is chiefly a slow background trend compatible with meteorological pressure change; its cause cannot be assigned uniquely from this instrument alone.
Consecutive observation comparison
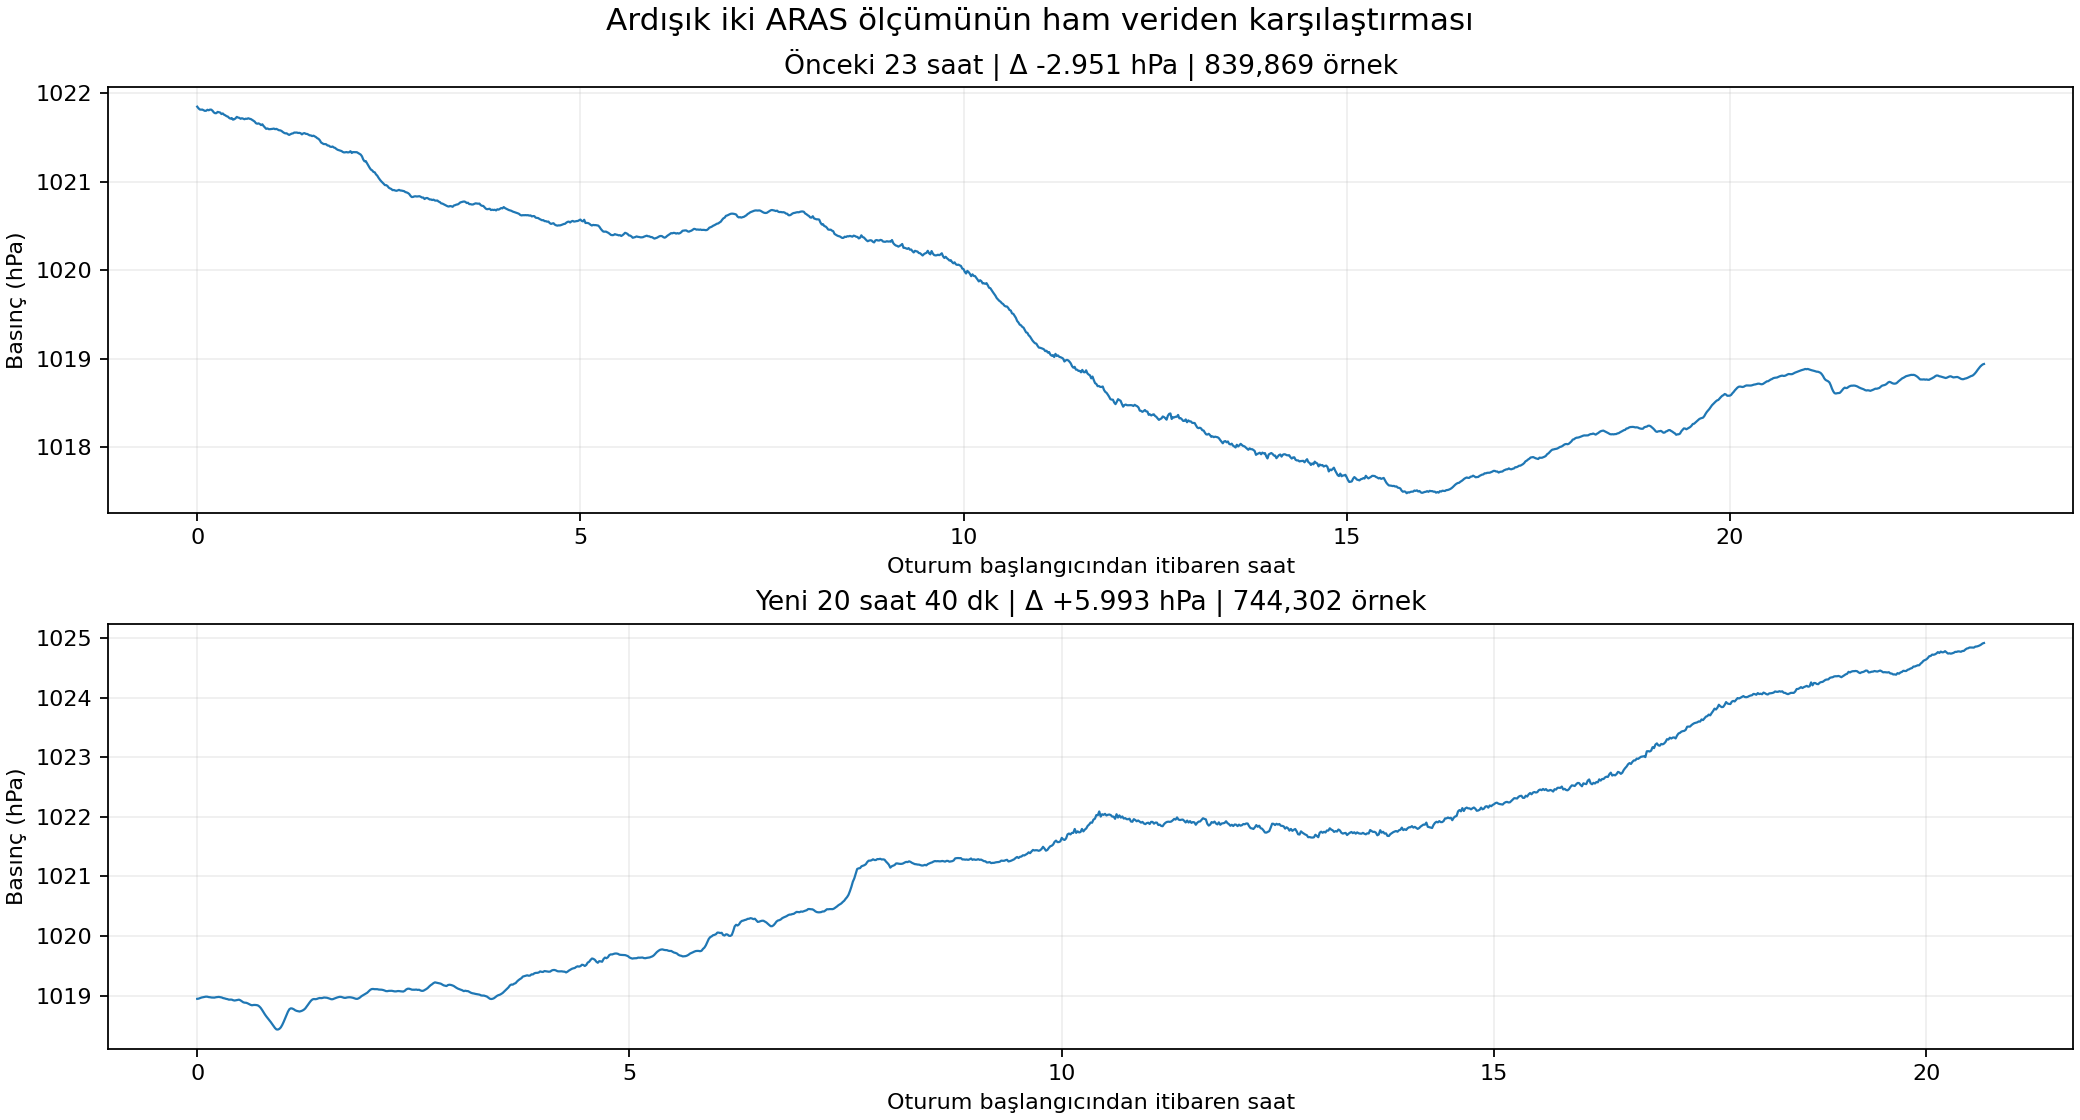
| Metric | Previous: 5–6 Nov | Follow-up: 7 Nov |
|---|---|---|
| Time span | 23.33 h | 20.67 h |
| 10 Hz sample count | 839,869 | 744,302 |
| Pressure change | −2.9508 hPa | +5.9928 hPa |
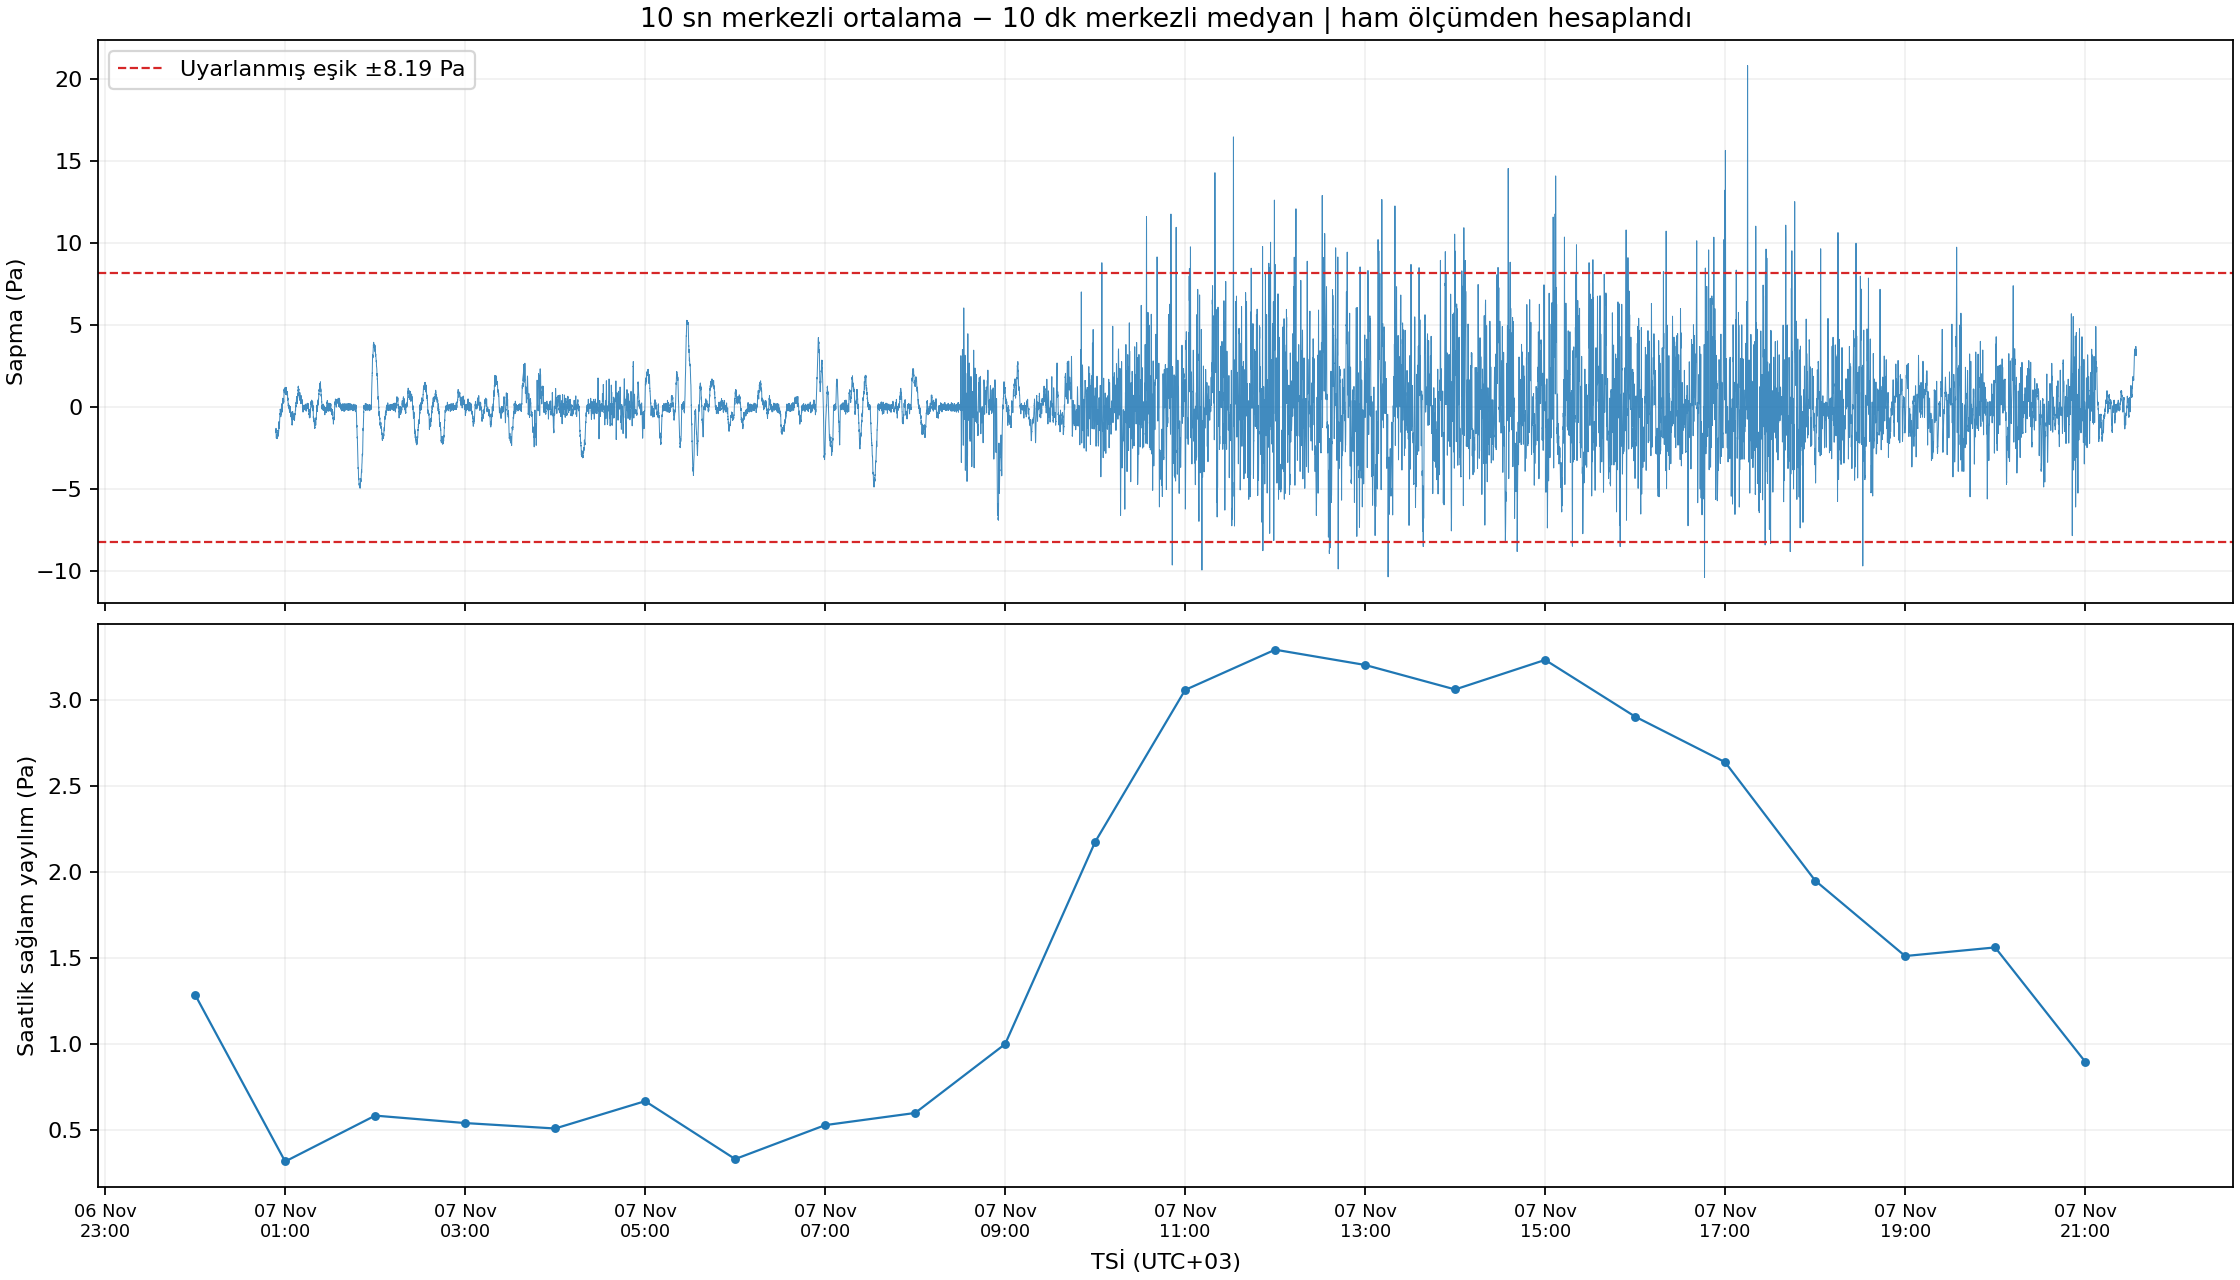
| 10 s residual robust scale | 0.714 Pa | 1.365 Pa |
| 99th percentile |residual| | 4.187 Pa | 8.064 Pa |
| Adaptive candidate clusters | 37 | 37 |
| Fixed previous-threshold clusters | 37 | 195 |
An identical adaptive-cluster count does not imply equally quiet conditions. Each record uses its own robust noise threshold. At the earlier fixed threshold, the new recording has 195 screening clusters; these are not 195 verified events.
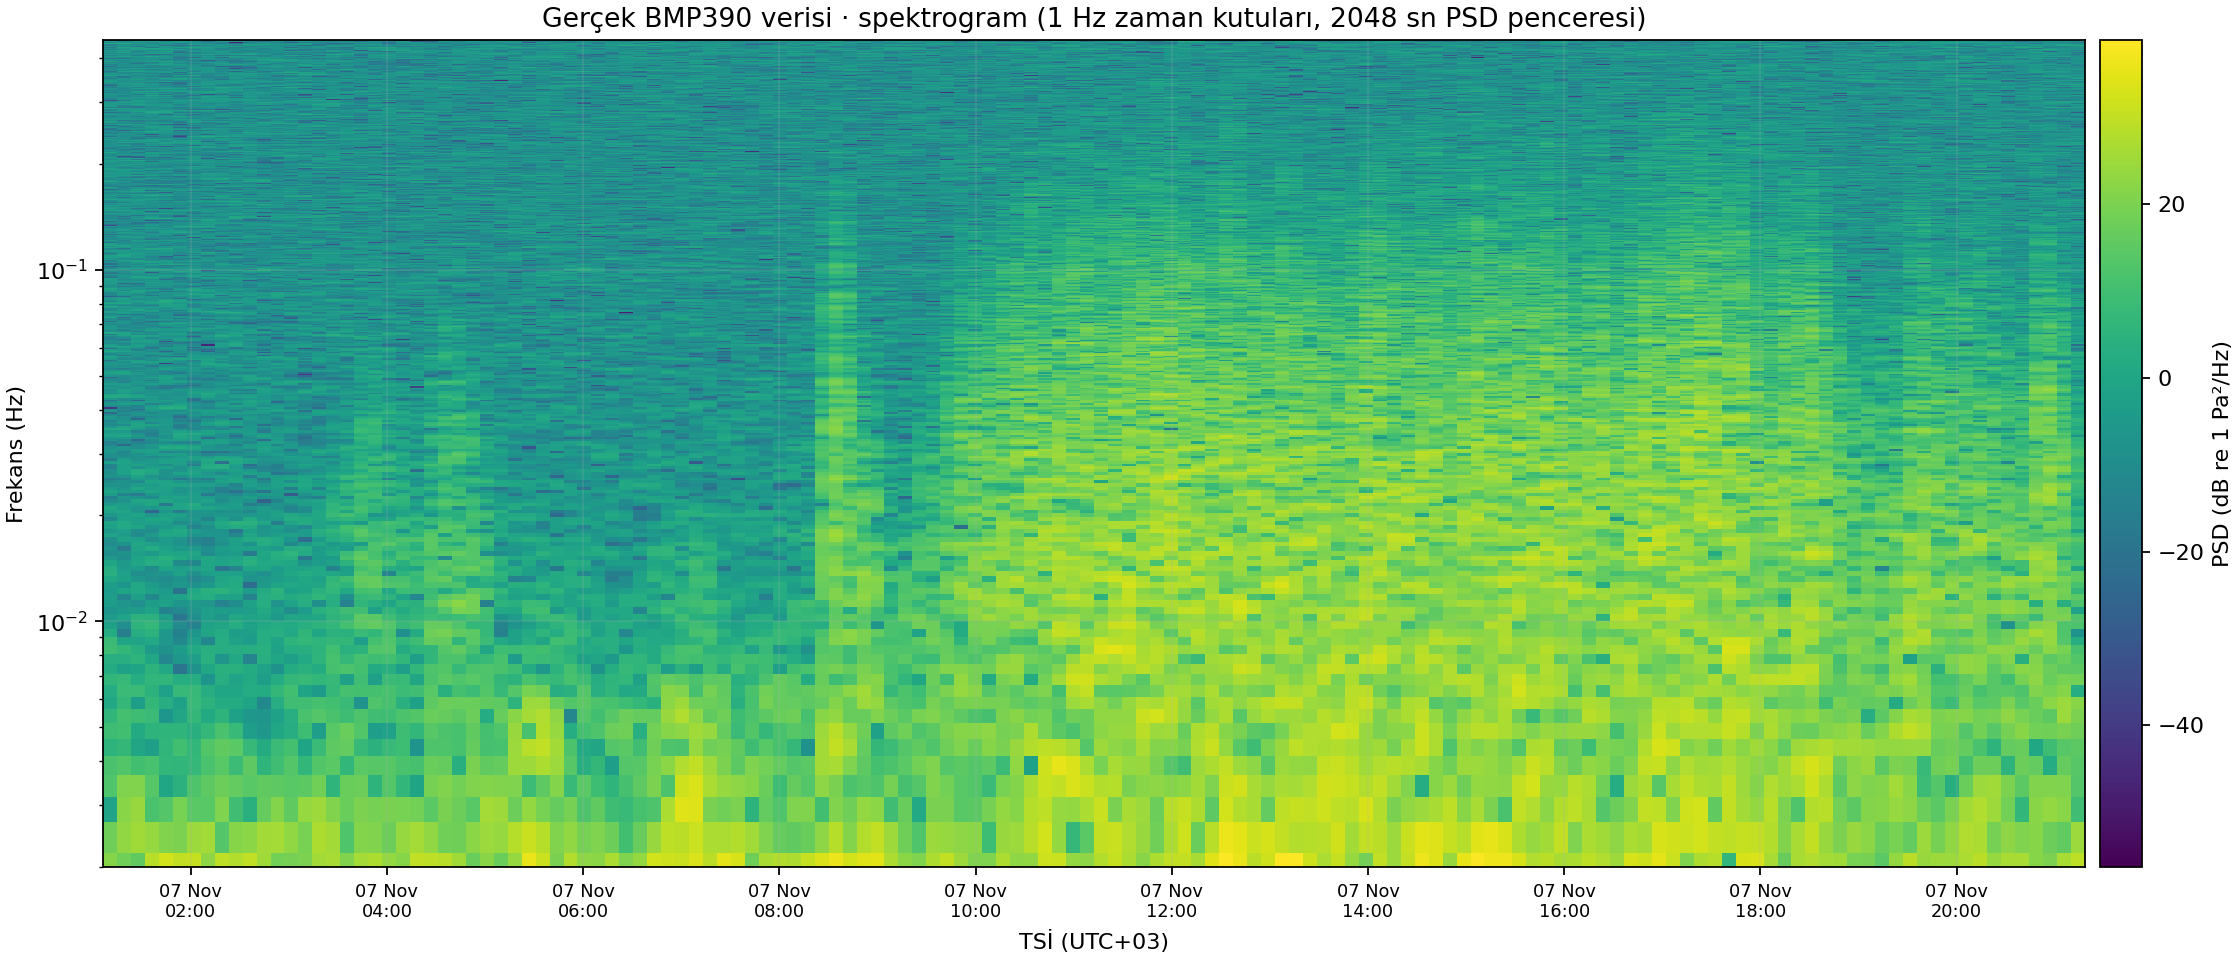
Power spectral density (pressure RMS)
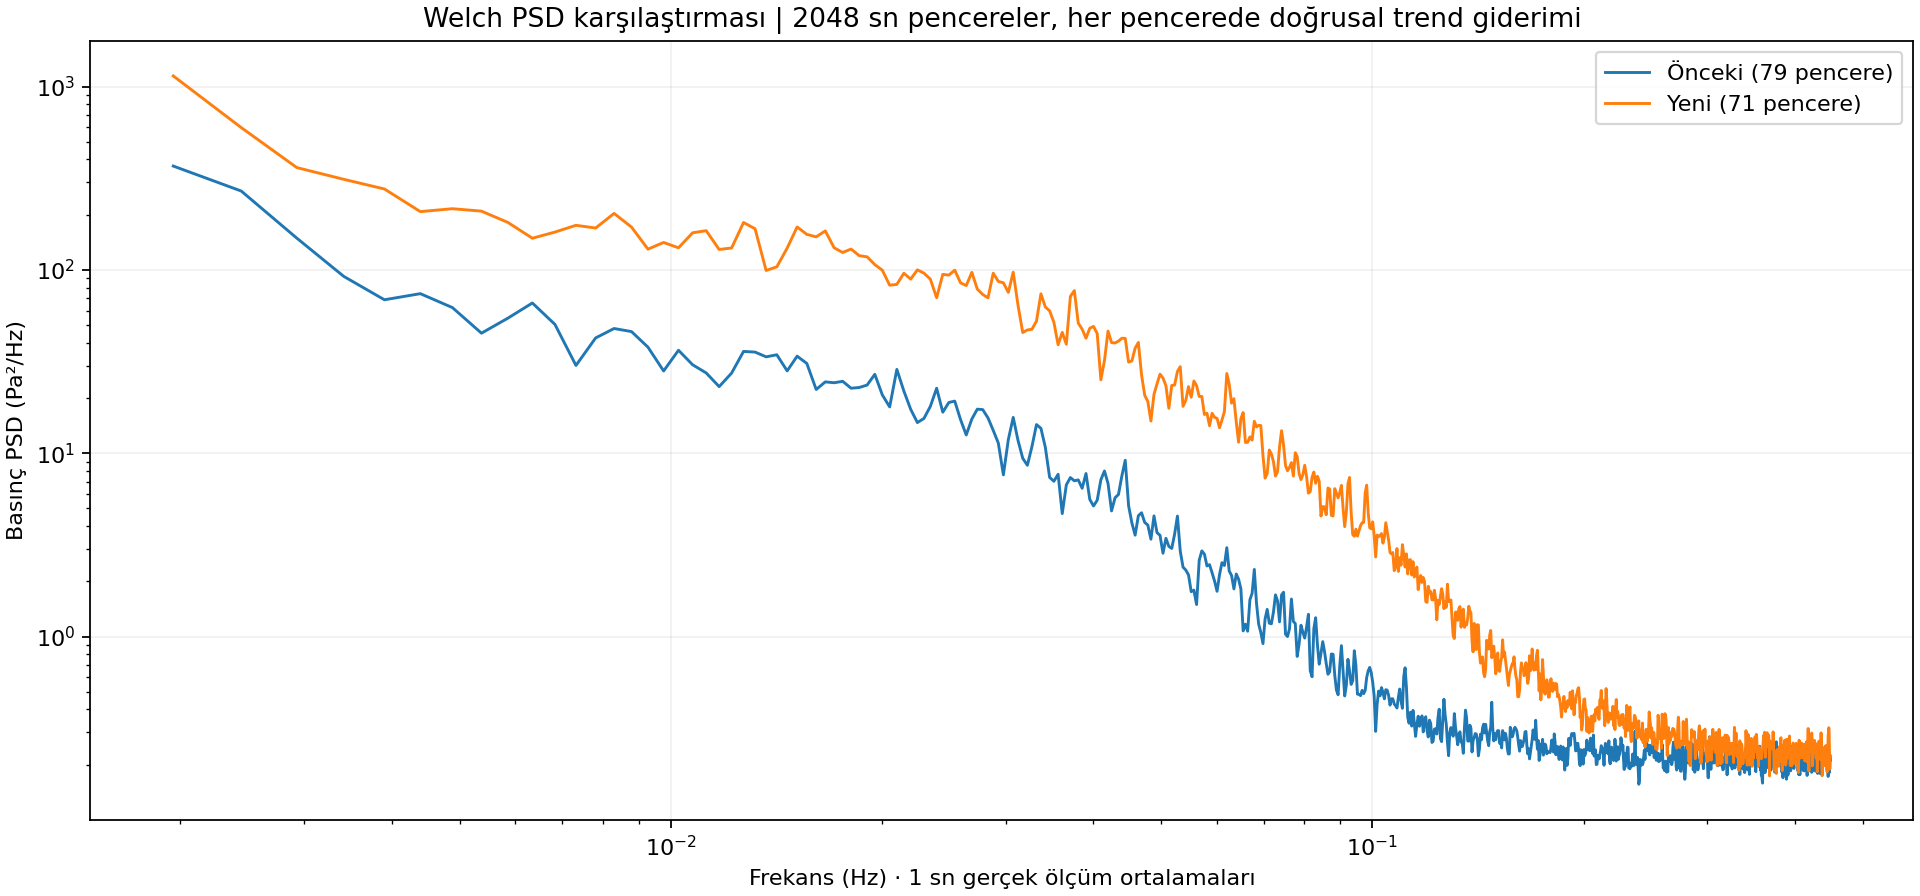
| Period band | Previous | Follow-up | Ratio |
|---|---|---|---|
| 100–300 s | 0.579 Pa | 1.099 Pa | 1.90× |
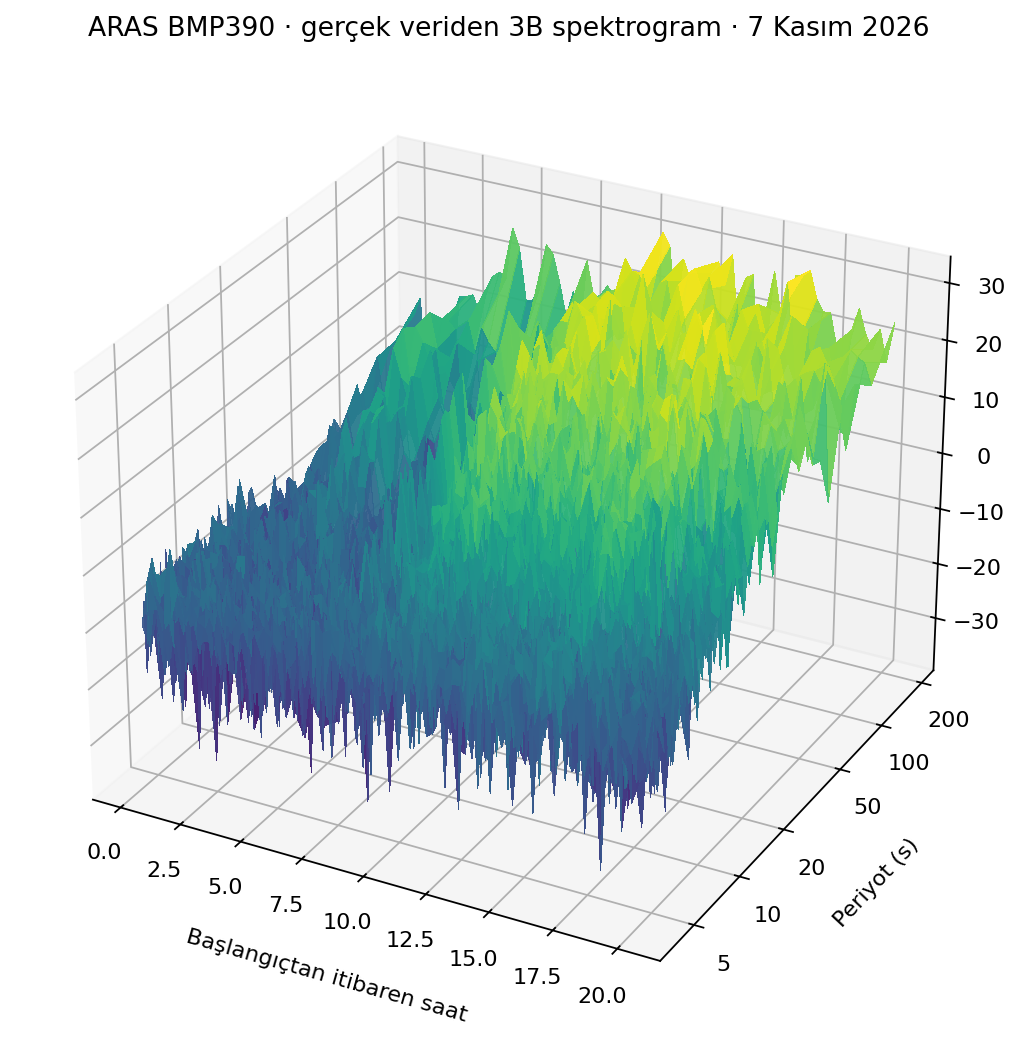
| 10–100 s | 0.811 Pa | 1.918 Pa | 2.37× |
| 2.5–10 s | 0.273 Pa | 0.418 Pa | 1.53× |
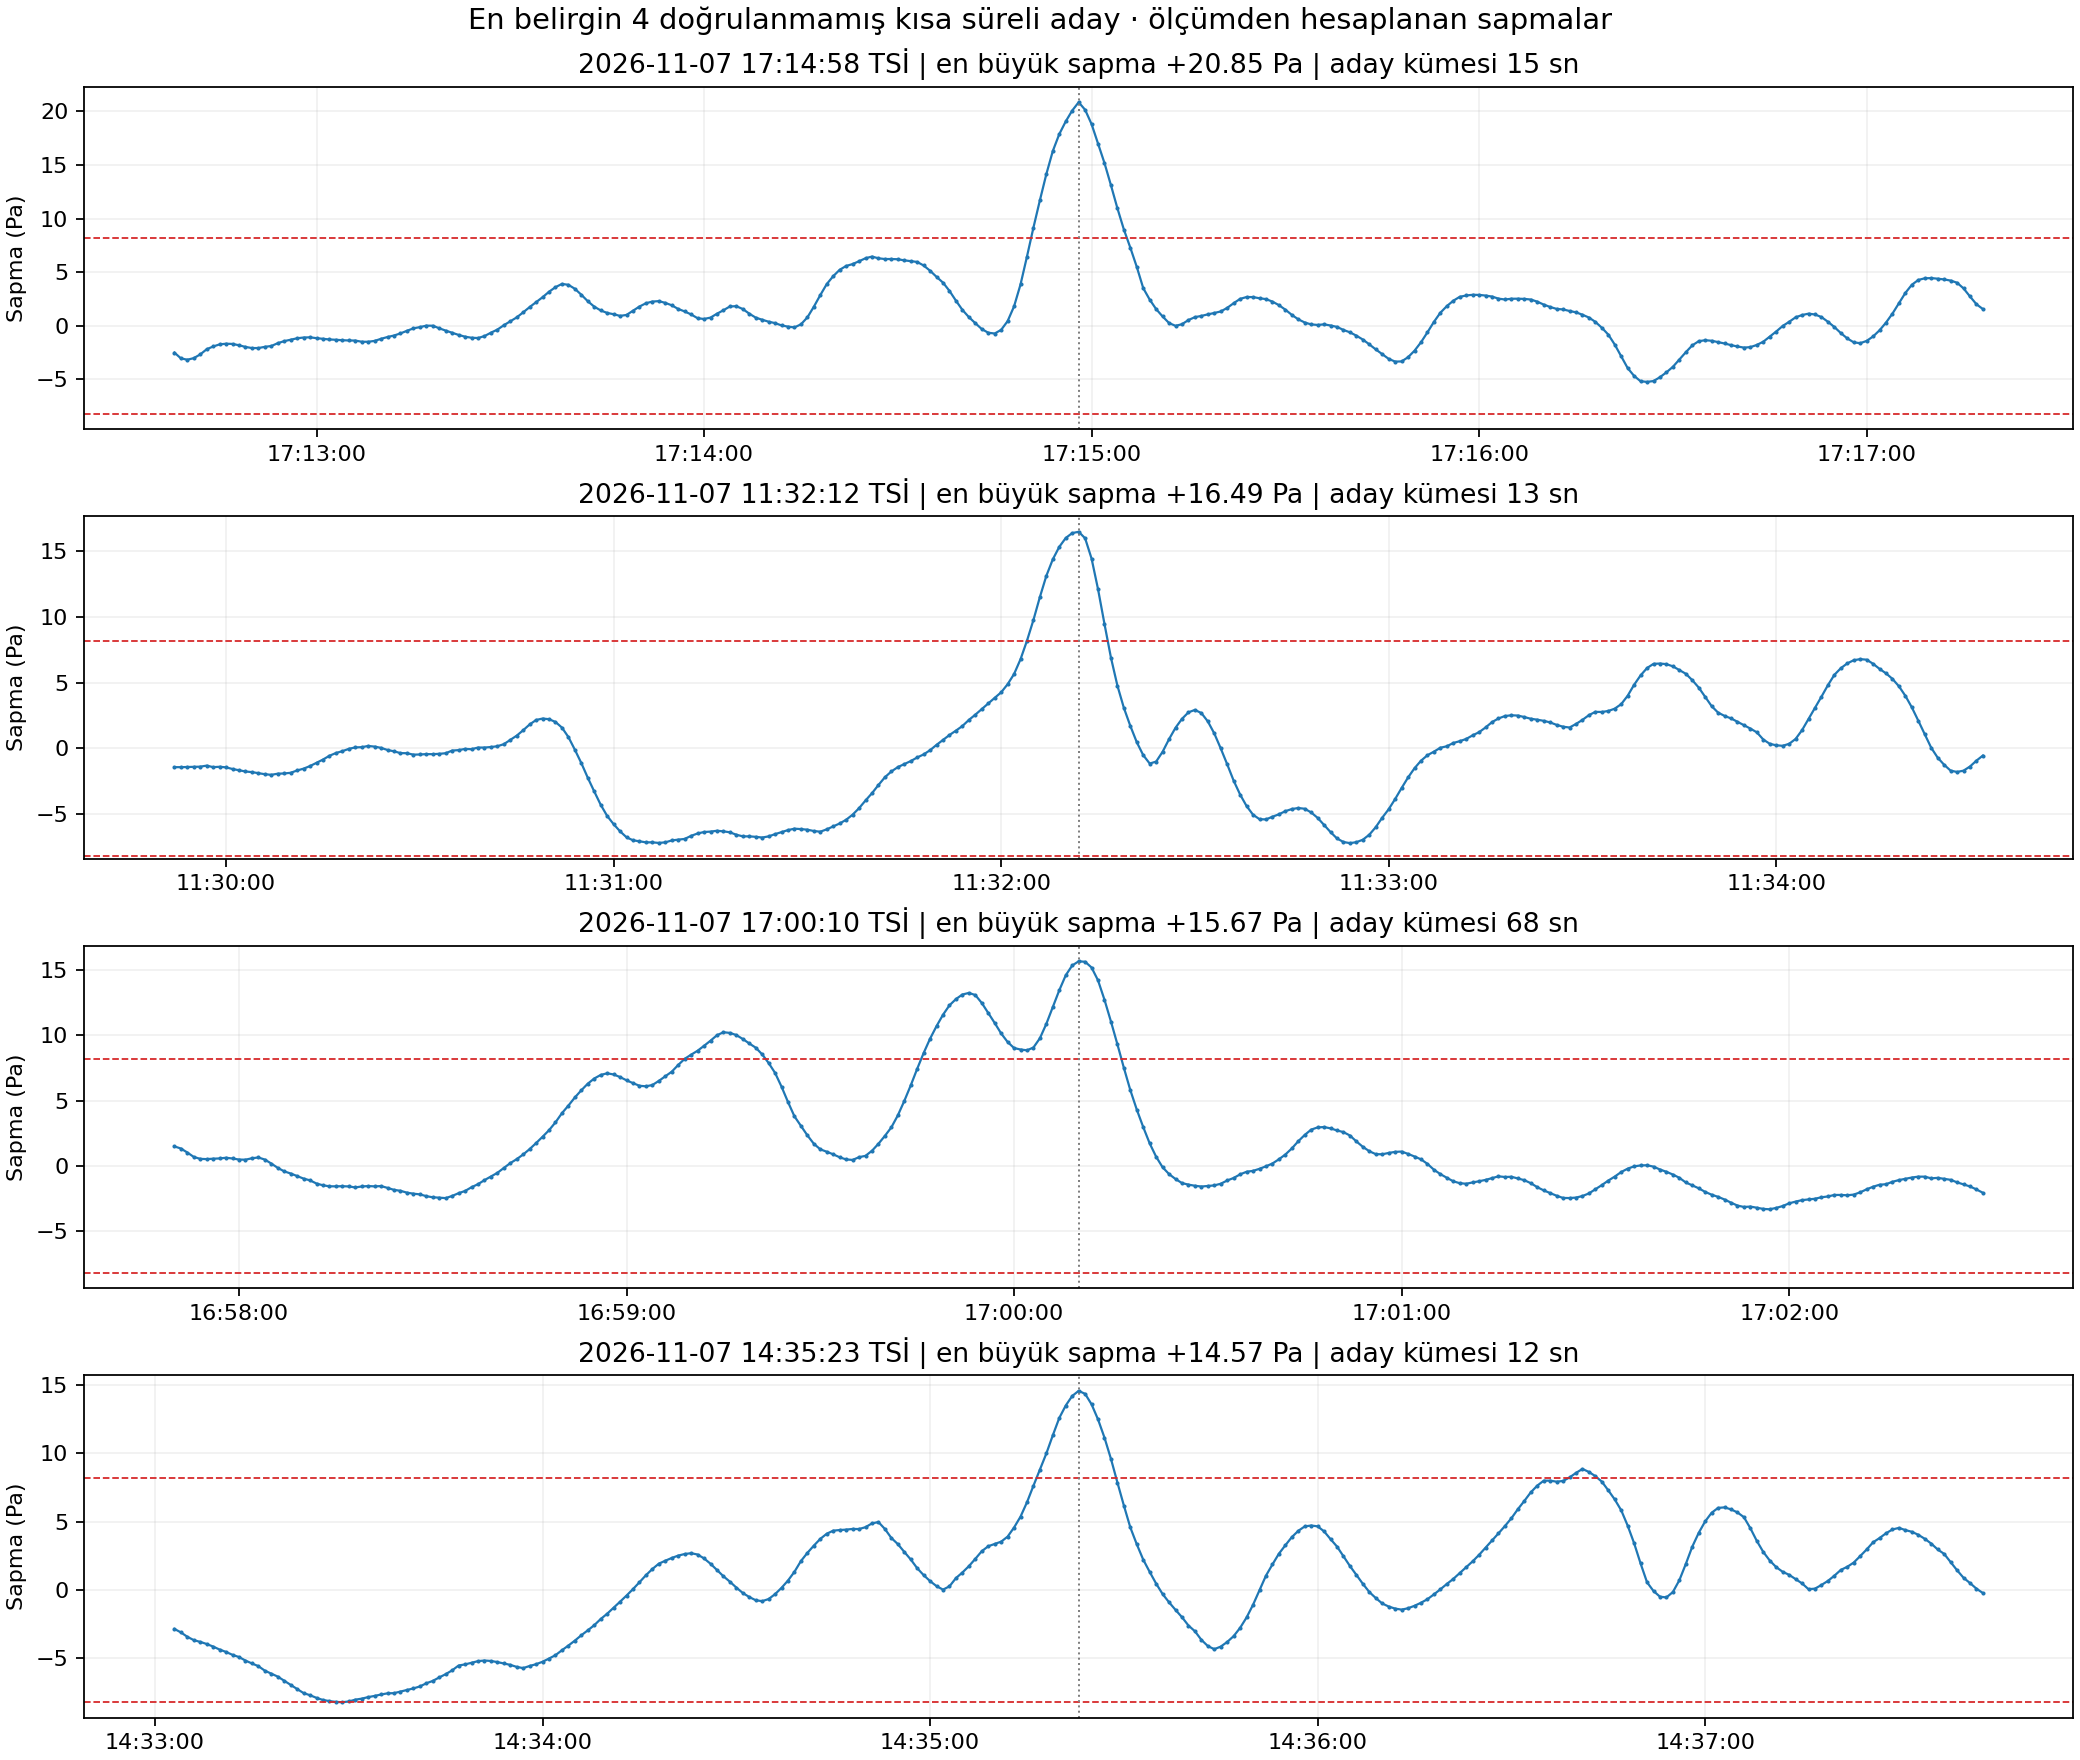
Strongest retrospective candidates
Peak values are deviations from a locally estimated baseline, not absolute pressure changes and not independent source attribution. Candidate cluster duration is the threshold-group interval, not necessarily the physical signal length.
| Peak (Istanbul / UTC+3) | Baseline-relative peak | Threshold cluster |
|---|---|---|
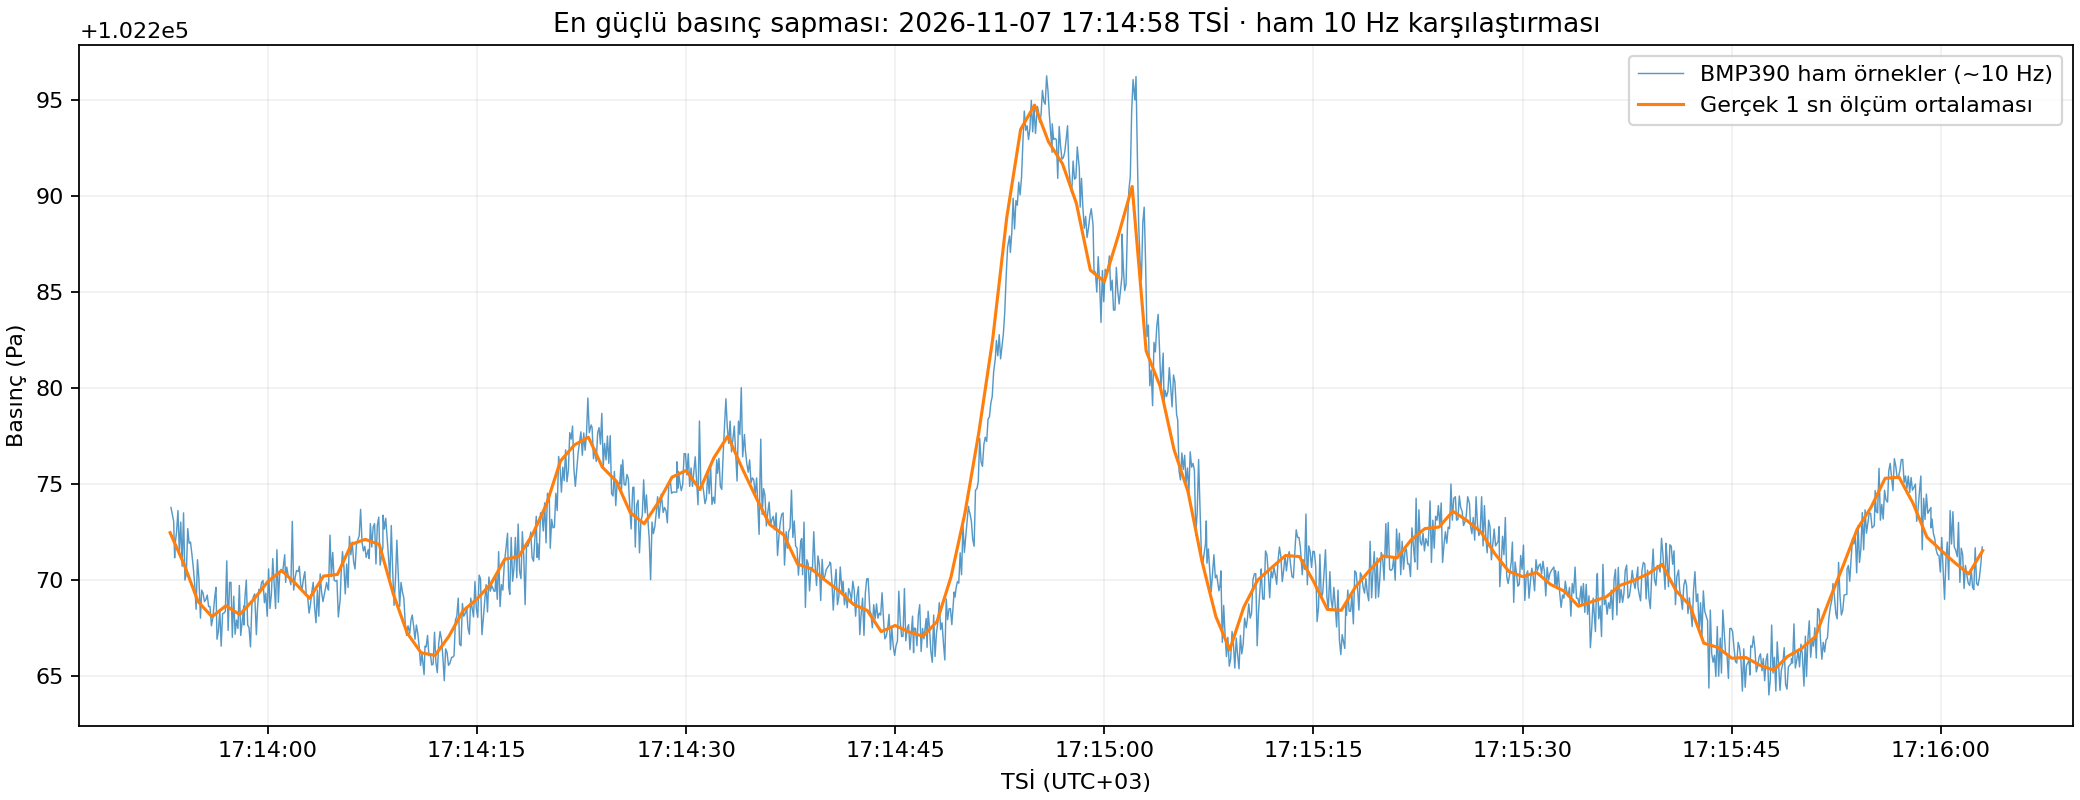
| 17:14:58 | +20.85 Pa | 15 s |
| 11:32:12 | +16.49 Pa | 13 s |
| 17:00:10 | +15.67 Pa | 68 s |
| 14:35:23 | +14.57 Pa | 12 s |
At 17:14:58 TSİ (14:14:58 UTC), multiple successive raw 10 Hz pressure samples support a short pressure pulse rather than a single corrupt line. Wind pressure, sensor enclosure/inlet effects, handling/mechanical vibration, local weather and remote-source hypotheses are not separated by this single recording.
Processing method and scientific limitations
The genuine 10 Hz samples were grouped into 1-second bins using measured samples only. For the anomaly screening series, a centered 10-second average was compared with a centered 600-second median. The robust scale was estimated using MAD = 1.4826 × median(|residual − median(residual)|); adaptive threshold max(0.035 hPa, 6 × MAD). Threshold exceedances separated by no more than 30 seconds were grouped; duration at least 9 seconds was retained as a candidate.
Welch power spectra used 2048-second Hann windows, linear detrending and 1024-second steps. The spectrogram used a 512-second step. Only windows with continuous measured 1 Hz bins entered the frequency-domain calculation; no data gap was interpolated. For the derived 1 Hz products, the Nyquist limit is 0.5 Hz; the preserved 10 Hz raw measurements have higher available sampling bandwidth but are not claimed to have a calibrated infrasonic frequency response.
Provenance: All figures are derived from ARAS's own pressure data. No synthetic event waveform, substituted external-station measurement or artificial gap filling was introduced. A single near-ground sensor does not uniquely distinguish environmental airflow, enclosure effects, meteorological fluctuations, or propagating infrasound.
Figures from genuine ARAS measurements
Select any figure to view at full resolution. Plots are measured or computed from real measured samples, with their processing described above.
Public report and reproducibility files
The complete compressed 10 Hz source CSV is included (21.88 MiB). Derivative CSVs and the report are separate, to avoid large downloads during live monitoring.
Source raw SHA-256: 7659976b7e74993b76ff0a29f28caeab221cfac4dea0a572531e40ca49746732. The new observation is a completed review snapshot ending at 21:34:08 Istanbul time; it does not describe measurements acquired after that time.
Türkçe bilimsel özet / Turkish summary
7 Kasım 2026 00:53:38–21:34:08 TSİ aralığında ARAS BMP390 sensöründen 744.302 gerçek ölçüm analiz edilmiştir. Basınç 1018,9342 hPa'dan 1024,9270 hPa'ya yükselmiş (+5,9928 hPa); sıra numarası kaybı ve boş 1 saniyelik zaman kutusu saptanmamıştır.
Önceki 23 saatlik kayıtla karşılaştırıldığında 10–100 saniyelik periyotlarda hesaplanan RMS 0,811 Pa'dan 1,918 Pa'ya çıkmıştır (2,37 kat). Yeni kayıt için geriye dönük taramada 37 doğrulanmamış anomali adayı belirlenmiştir. 17:14:58 TSİ'deki en güçlü aday yaklaşık +20,85 Pa yerel sapma göstermiştir.
Bu sonuçlar deprem, volkan, patlama veya doğrulanmış infrason tespiti anlamına gelmez. Ham veri değiştirilmemiş, yapay yapı eklenmemiş, veri boşlukları doldurulmamıştır.