BMP390 · First 23 Hours
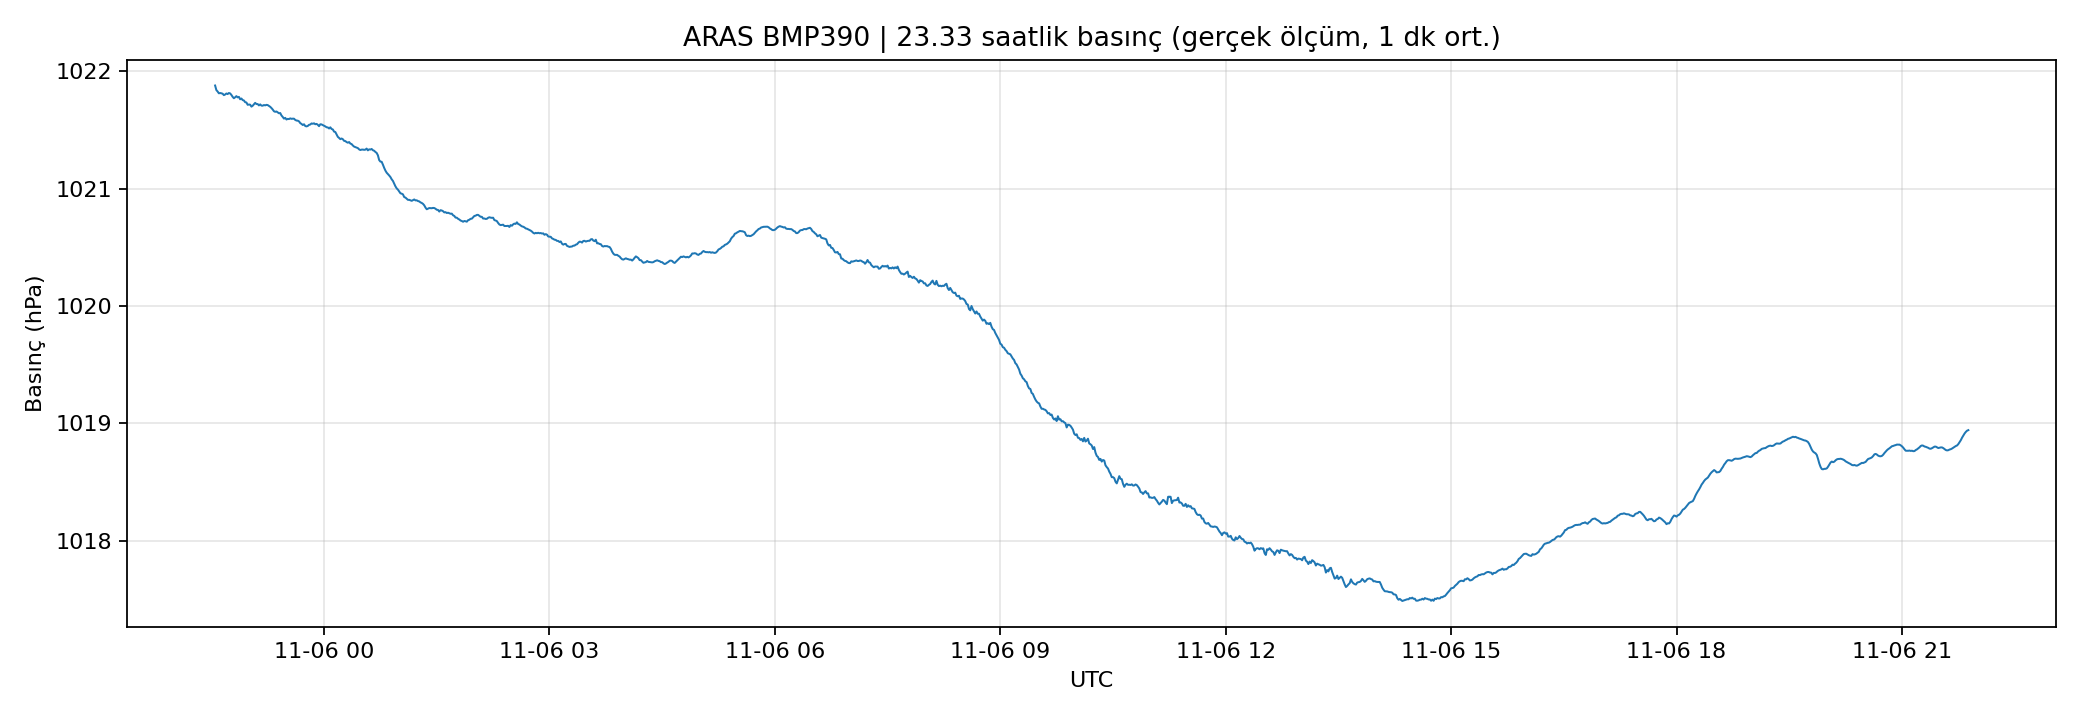
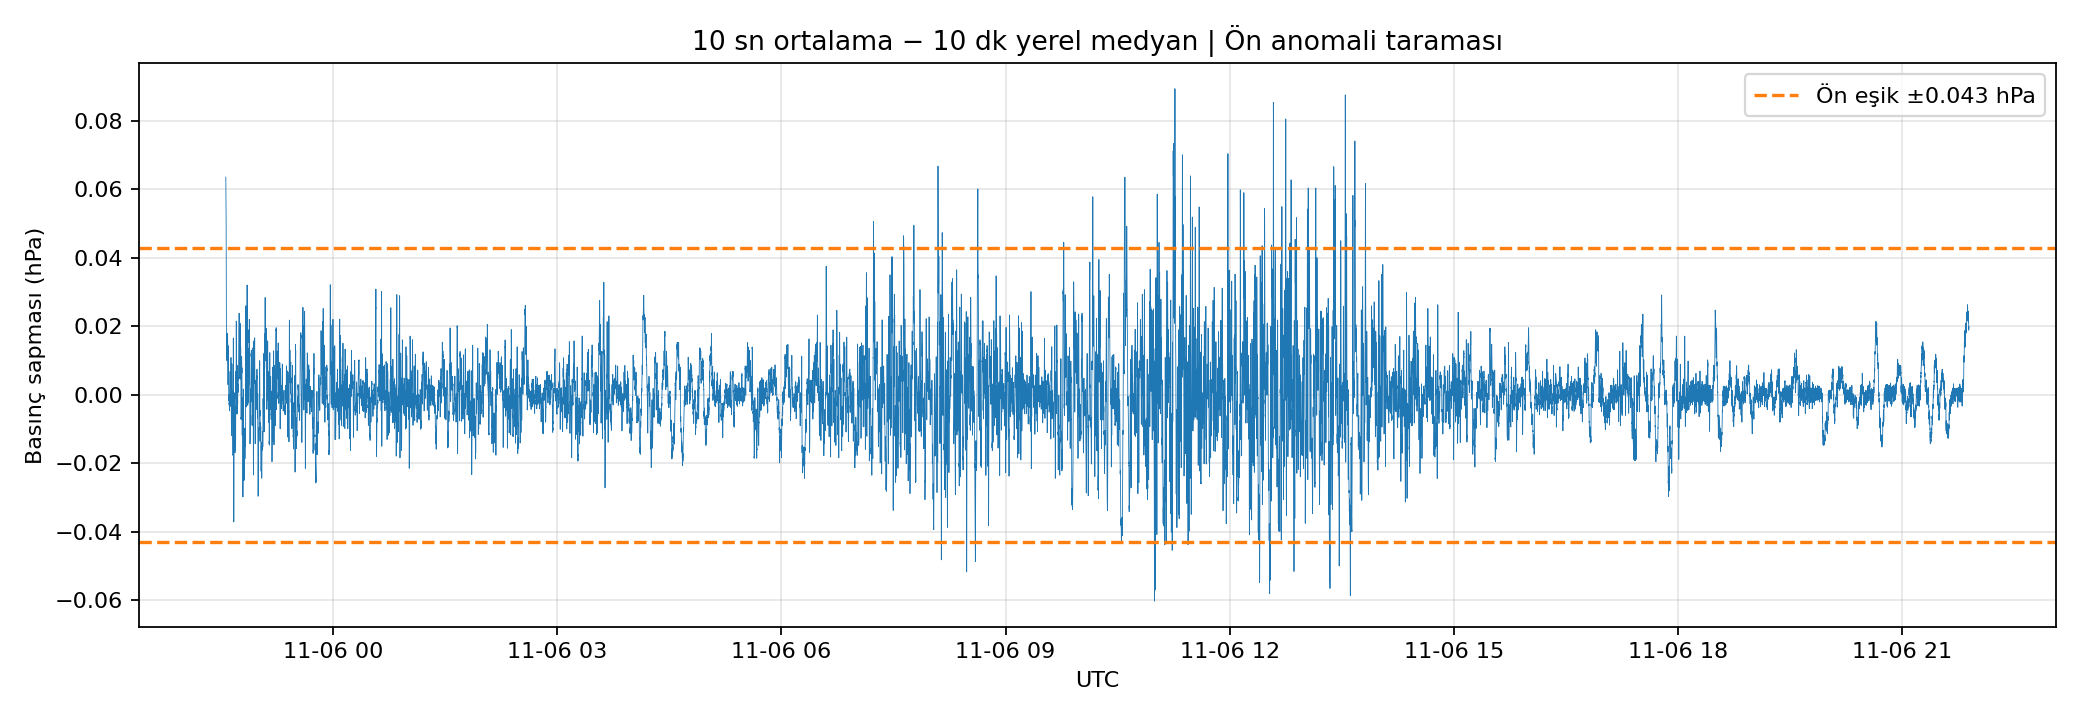
Summary. The station recorded 839,869 pressure samples over 23.33 hours. Pressure changed from 1021.8904 to 1018.9396 hPa (−2.9508 hPa). An exploratory retrospective scan flagged 37 short-period deviations for review; none has a confirmed atmospheric source.
Measured quantities
| Observation interval (UTC) | 2026-11-05 22:33:51 – 2026-11-06 21:53:37 |
|---|---|
| Samples / nominal acquisition | 839,869 / 10 Hz |
| First → last station pressure | 1021.8904 → 1018.9396 hPa |
| Minimum / maximum pressure | 1017.4426 / 1021.9100 hPa |
| Sequence gaps | 0 detected |
| One-second bins with absent measurements | 1 |
| Exploratory 10-second residual MAD scale | 0.00715 hPa |
| Retrospective anomaly-screen threshold | 0.04288 hPa |
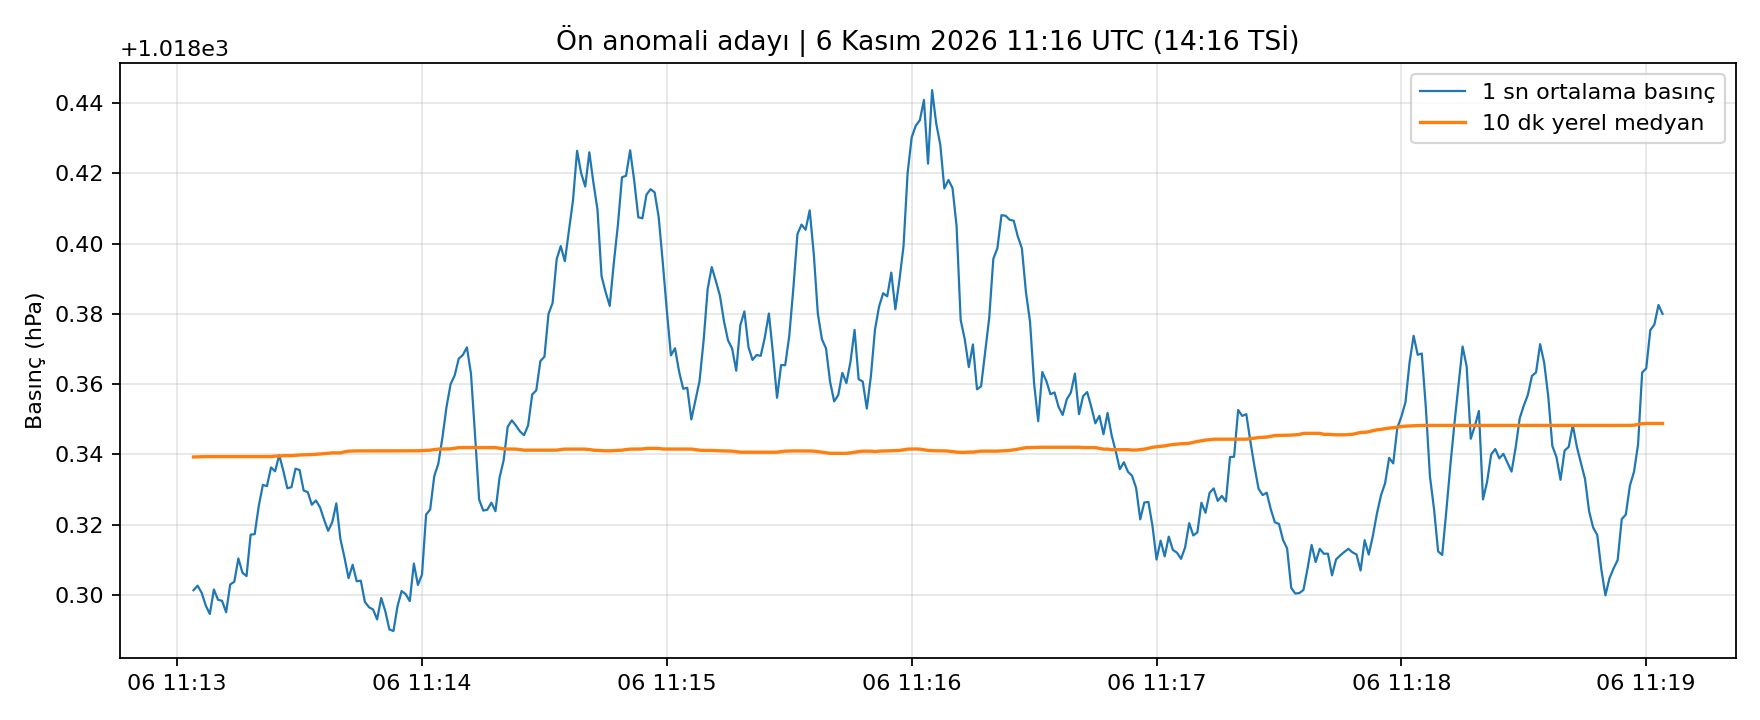
| Preliminary candidate intervals | 37, unverified |
Station pressure — 23-hour trend
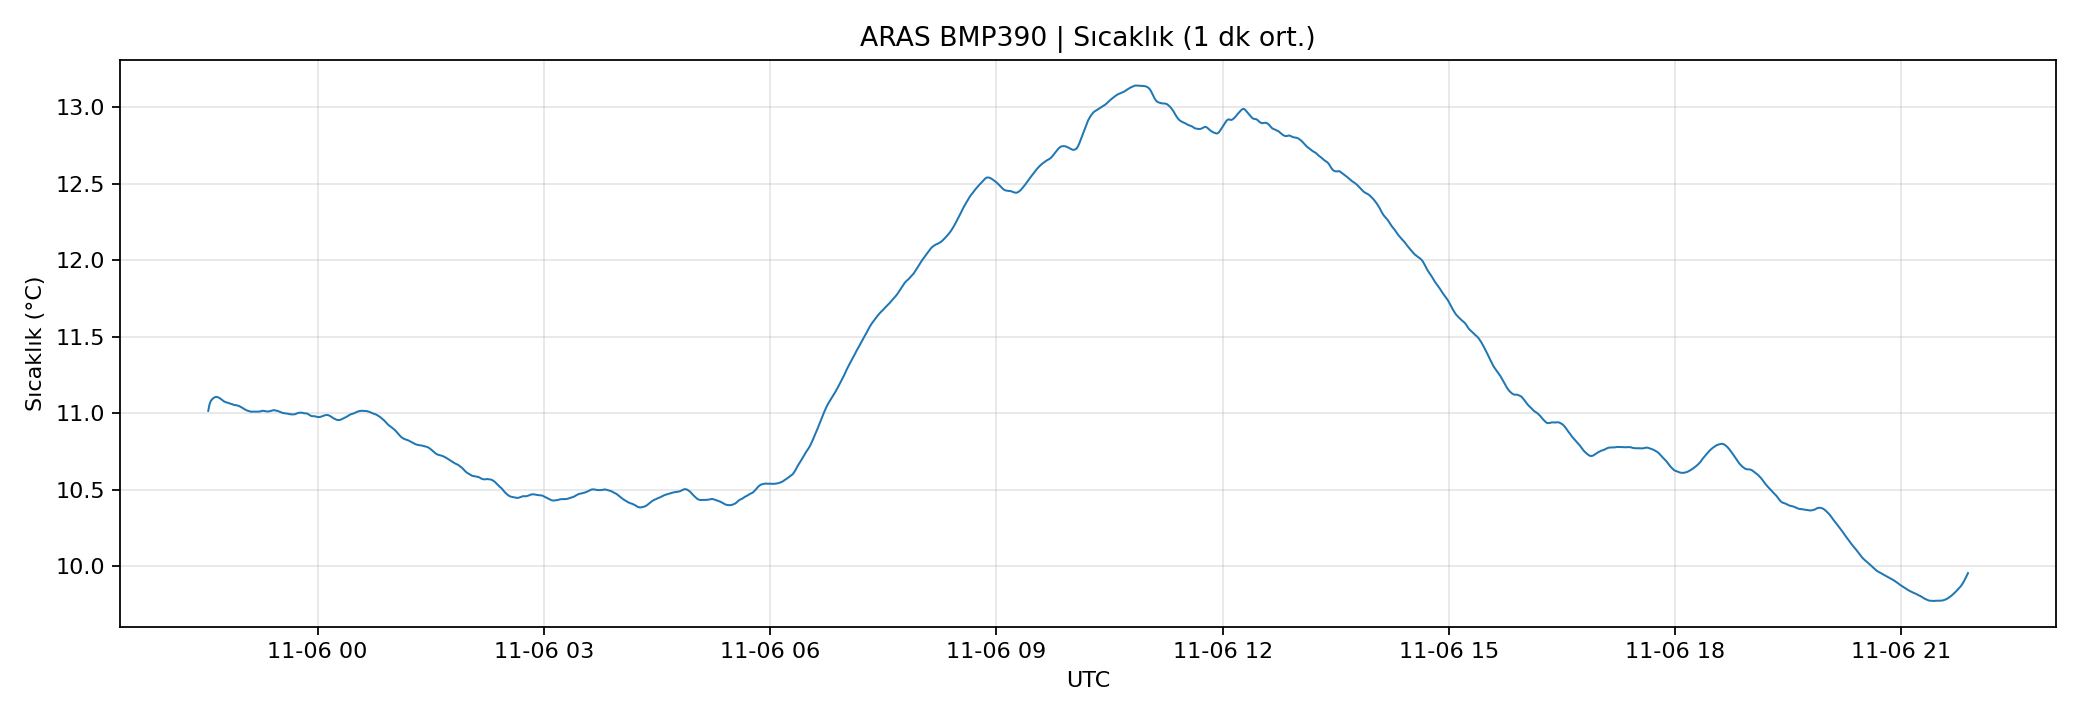
BMP390 sensor temperature
Short-period pressure residuals
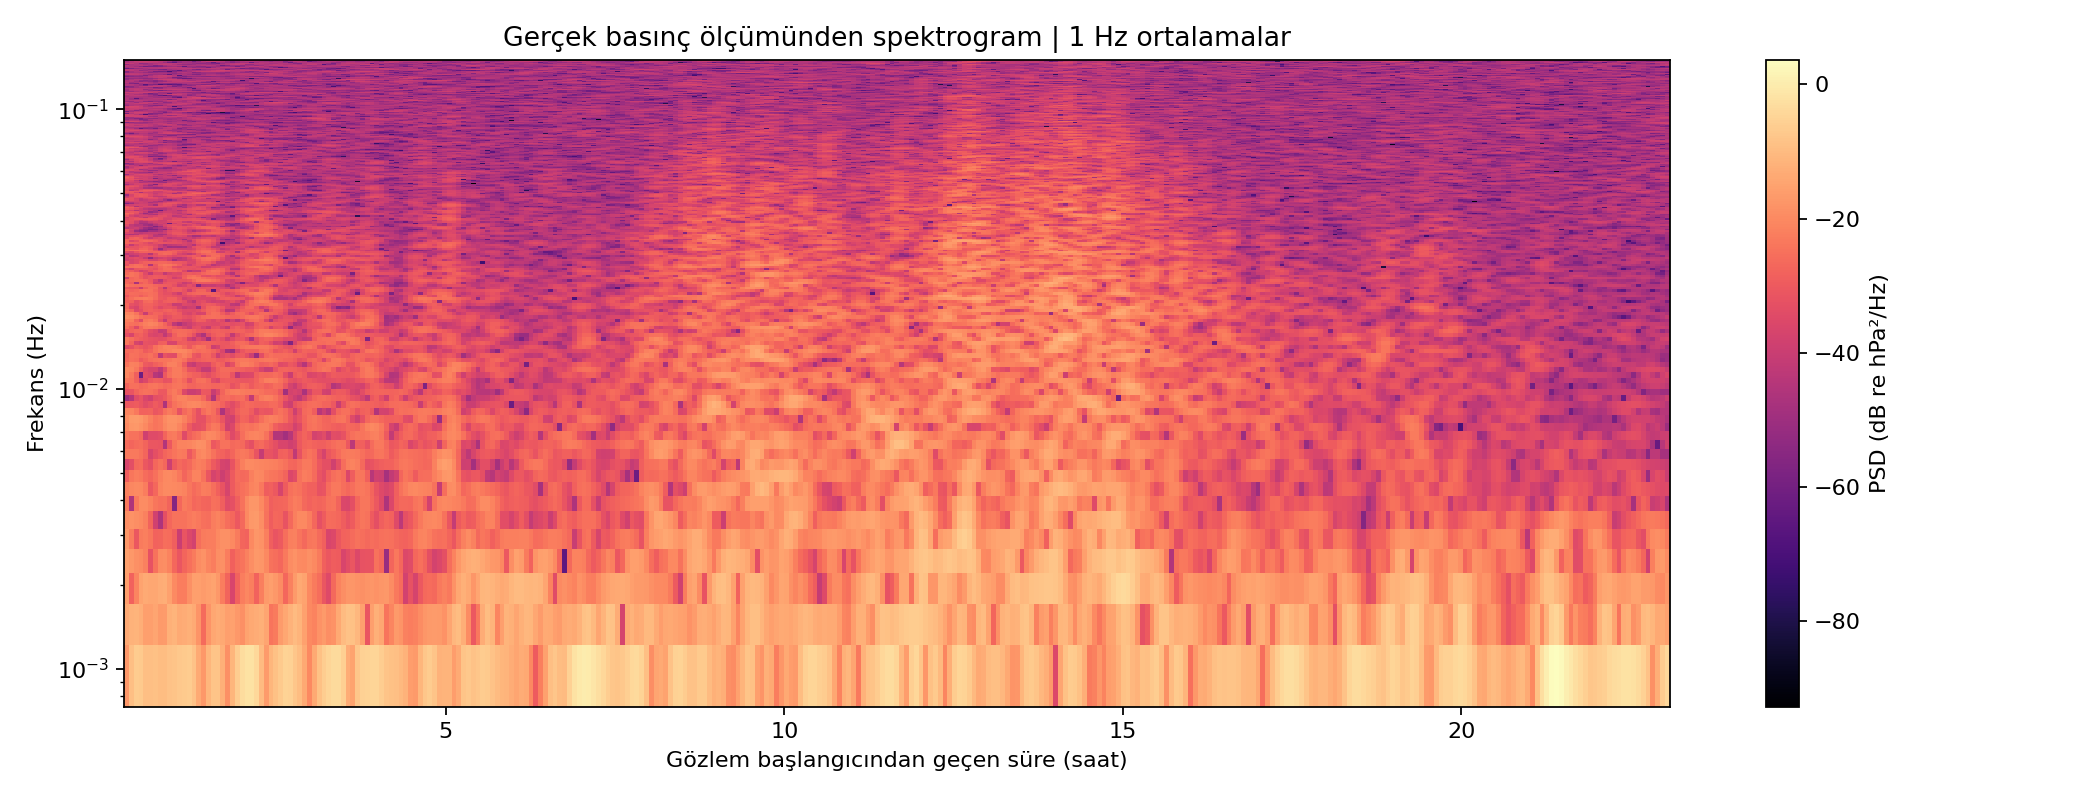
Pressure time–frequency spectrogram
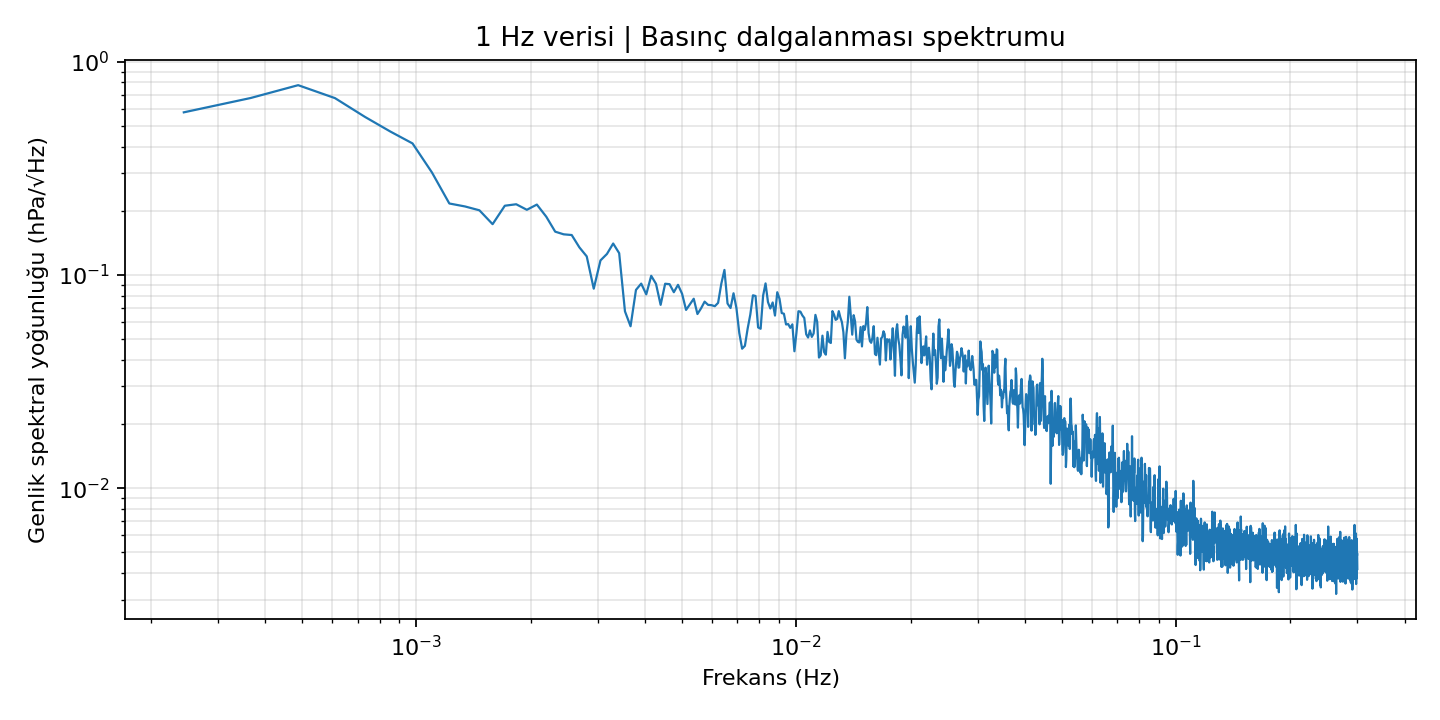
Pressure power spectral density
Largest preliminary deviation — close view
Method and limitations
The archive is a retrospective review of measurements collected by ARAS with a Bosch BMP390 and Raspberry Pi Pico H. The exploratory anomaly count uses 10-second aggregation and a centered 10-minute baseline; because this baseline includes later data, the count must not be interpreted as detections from the separate live WARNING algorithm. The 1 Hz spectrogram from the original longer analysis used a display-only fill for one missing second; the unmodified original raw CSV did not contain synthetic samples. Weather, wind, sensor housing, temperature, and local disturbances remain possible explanations.
Scientific status: UNVERIFIED PRESSURE FLUCTUATIONS — NOT A CONFIRMED EXTERNAL EVENT.